





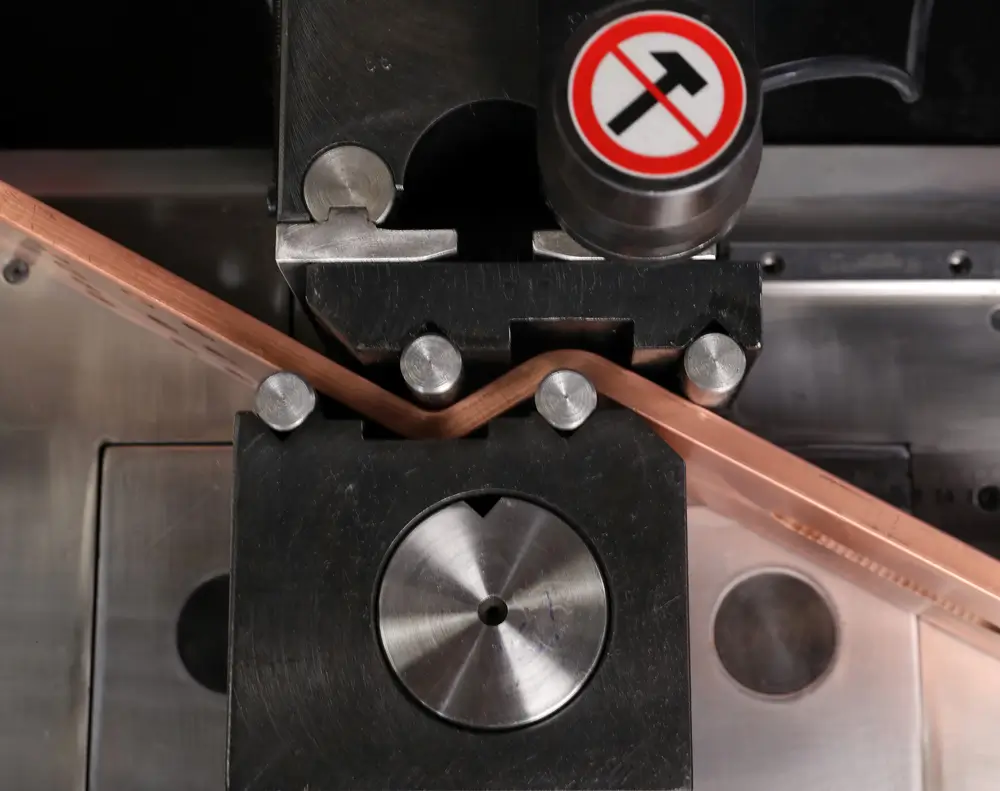
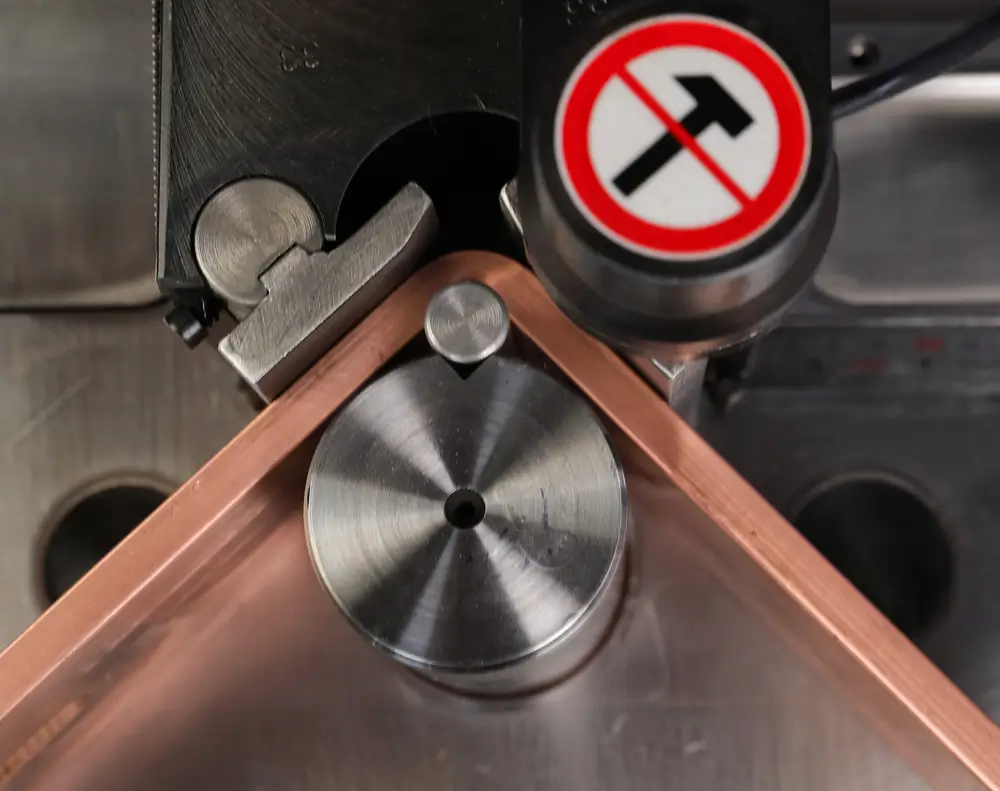
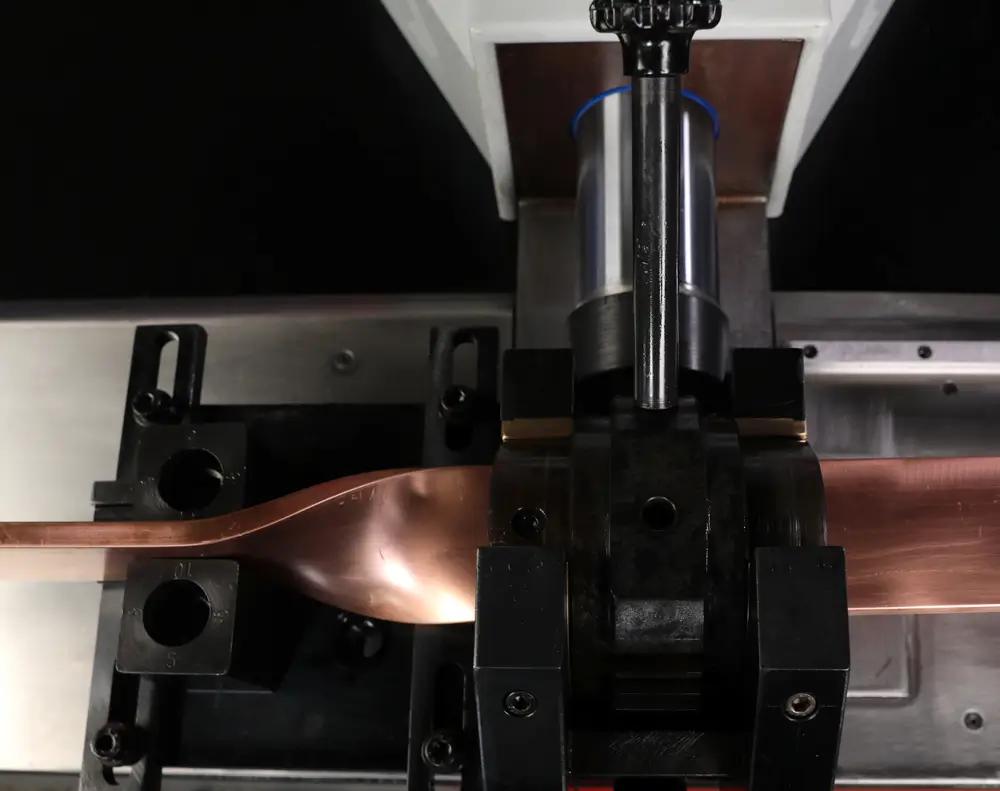
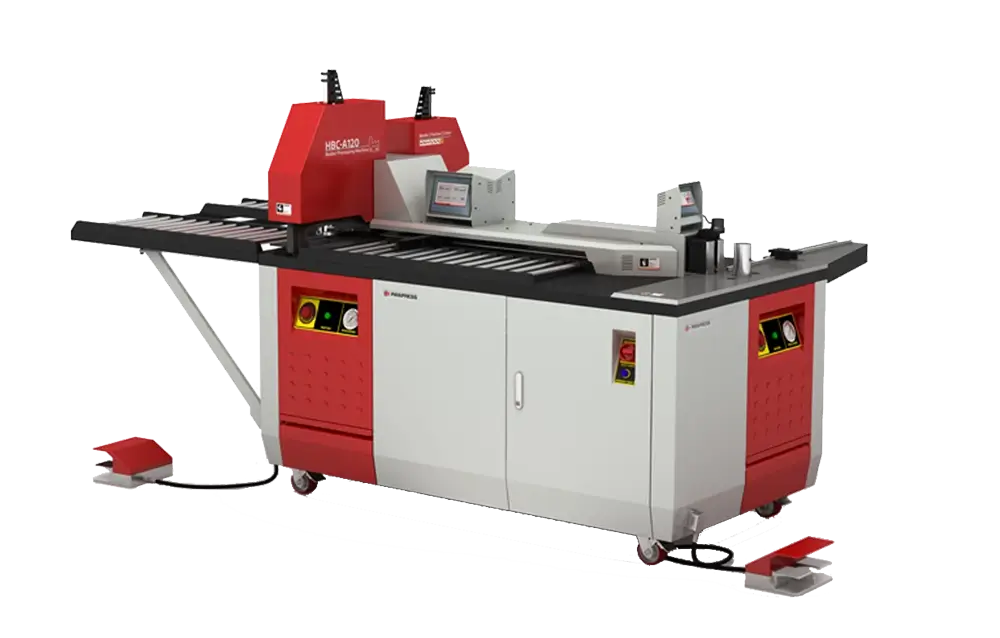
If you’d rather listen than read, feel free to play the audio file below for the rest of this article.
The short answer Busbar Machine Distribution Profitable
Yes, busbar machine distribution can be profitable. It is almost never profitable on the machines.
Note: Every figure in this article is approximate. Actual profitability depends on your territory, cost base, volume and market conditions.
Surveys of North American dealerships put the requirement at 6–7% margin on new and used sales simply to break even. Five to seven percent is treated as the practical minimum, and volume should take a sales department to 8–10% net income at best.
One widely used benchmark set is harsher still. It puts wholegoods at 2.5% bottom line at best, once write-downs are counted honestly, against 12% on parts and about 15% on service.
Draw the conclusion plainly. A distributor who sells machines and nothing else runs at close to zero margin and carries every risk. A distributor who sells machines in order to build a parts and service base has a real business. That is the machinery dealership profitability question in two sentences.
These figures come from agricultural and construction equipment dealer studies, not from this product category. The structure transfers. The exact numbers will not.
If you are evaluating representation in your own market and want the real numbers rather than a pitch, our busbar machine distributor programme sets out the machine range, the ideal partner profile and how to apply.
Where the demand actually comes from
Demand is real and it is uneven, and both halves of that sentence matter more than any forecast you will be sent.
If you would like to explore this subject further, you can read more about it here.
The structural drivers
The clearest signal is not a CAGR at all. Consultants reporting from Data Centre World London 2026 put roughly 70% of new data centre projects on busbars in the grey space rather than traditional cabling.
Busbar market growth forecasts are less useful than they look. Global Market Insights estimates USD 22.5 billion in 2025, rising at 4.7% to USD 35.9 billion by 2035. MarketsandMarkets starts at USD 15.72 billion in 2025 and reaches USD 27.71 billion by 2035 at 5.8%. Future Market Insights sits between them. Three houses disagree by nearly seven billion dollars on the same base year, so treat direction as reliable and magnitude as noise.
Note: These are third-party estimates built on different methodologies, which is why they disagree. Read them as approximate direction, not as measured facts.
Correct the category error too, because it costs money. That is the market for busbars, not for busbar machines. Machine demand follows fabricator capital investment, which moves with construction cycles, grid spending and interest rates. Switchgear and panel builders stay the anchor customers.
For a clearer and more complete explanation, this page goes into far more depth than we can cover in a short text.
What could stall it
Be even-handed, because the tailwind is not evenly distributed. Analysts expect 30–50% of large-scale data centre capacity scheduled for 2026 to slip or be cancelled, largely on power constraints and electrical equipment shortages.
Note: That range is a forward-looking estimate, not a recorded outcome, and it will vary sharply by region.
Three further counterweights matter. Busbar systems carry a higher upfront cost than cable and need precise engineering and skilled installation, so smaller firms hesitate on budget grounds. Machine purchases are capital expenditure, and capex is the first line a panel builder freezes when interest rates or order books move. The same shortages that delay data centres also stretch lead times on the switchgear your customers build.
Replacement cycles are also long. A machine you sell today removes that customer from the market for years.
The practical implication is simple. Forecast your first three years on the customers you can name, not on a CAGR.

Where the margin actually is
Three revenue lines, three completely different margin profiles. The line with the lowest margin is the one every applicant focuses on, and the two that pay for the business are the ones they skip.
Readers who want to understand the reasoning behind this will find this detailed article very useful.
The machines
Dealer surveys put the required margin on new and used equipment at 6–7% just to break even. Volume takes a sales department to 8–10% net income at best, and a practising dealer’s harsher read puts wholegoods at 2.5% bottom line once write-downs are honest.
Note: These are approximate survey averages. What you realise on any single machine moves with discounting, freight, financing and trade-in valuation.
The reason is structural. Your customer compares quotes, the manufacturer sets the floor price, and any discount you offer comes out of your side of the deal.
For perspective on where the value actually sits, industrial machinery manufacturers themselves run 25–40% gross margin. Commodity-like products sit at 25–30%, and specialised precision equipment reaches 35–40%.
The takeaway is short. The machine sale buys you the relationship. It does not pay for the business.
Most of the common questions are already answered in this helpful resource.
Parts and tooling
This is the profit engine, and it is the section most applicants skip. Association cost-of-doing-business data put average gross margin on parts at 35.3%, up from 31% in the previous study.
On a bottom-line basis the benchmark is around 12%. A healthy dealership typically runs parts volume at roughly double its service volume, so the ratio is as important as the margin.
Note: Parts margin is an average with a wide spread. Yours depends mostly on how much of your installed base buys consumables from you rather than from a cheaper source.
Name what parts means in this category. Punches, dies and blades first, then hydraulic components, seals and control parts.
Now the strategic point. Tooling consumption is proportional to how hard the customer runs the machine. A well-used machine is an annuity that pays for years. A badly supported one is a dead account, and somebody else sells the consumables into it while you keep the paperwork.
Service
Service carries the highest bottom-line benchmark of the three lines at about 15%, and European law helps you sell it. Employers must inspect work equipment after installation and keep it maintained throughout its working life, using competent people.
Note: Approximate again. Technician utilisation, travel distance and local labour rates move this line more than any other.
What service covers here is specific: installation, commissioning, operator training, preventive maintenance contracts, breakdown response and calibration.
The defensive value goes beyond the margin. A technician in the customer’s plant every quarter is the reason the next distributor’s cold call fails. In the same benchmark set, parts typically return around four times, and service around three times, the net profit that equipment sales deliver.
Add the constraint honestly. Service revenue is capped by technician headcount, and technicians take years to train. You cannot buy your way out of that constraint quickly, and neither can your competitor.
To see how others have approached the same situation, take a look at this practical example.
What a realistic revenue mix looks like
You reach an operating margin above 5% only when parts and service together pass 25% of total business — that threshold, not machine volume, is what decides the outcome.
Practitioner mixes cluster in a narrow band. One dealer targets 70% equipment, 20% parts and 10% service, and finds each department then contributes about a third of gross profit. Another targets 65% wholegoods, 16% parts, 16% service and 3% other, with the best margin in parts and service.
The worked example below is a hypothetical USD 100 million dealership from the same benchmark set. The absolute figures do not transfer to your situation, and they are not meant to. The ratios do, and so does the arithmetic behind them.
| Revenue line | Typical share | Bottom-line benchmark | Worked example |
|---|---|---|---|
| Machines, new and used | 65–70% | 2.5% at best | $75m |
| Parts and tooling | 16–20% | 12% | $17m |
| Service | 10–16% | 15% | $8m |
| Whole business | 100% | about 5.1% | $100m |
Note: Every figure in this table is approximate and illustrative, and the example business is hypothetical. Take the ratios, not the amounts.
Scale it down honestly. A distributor turning over a small fraction of that volume faces exactly the same structural requirement, because the requirement is a ratio rather than an amount. Your parts and service revenue mix is the number to model first, before you model a single machine sale.
Close with the diagnostic. If your business plan shows parts and service under 20% of revenue in year three, the plan does not work, however many machines you sell.
The seven risks
These equipment distributor risks are ordered by how often they kill a new distributorship, not by how dramatic they sound.
1. Capex cyclicality. Your customers buy machines out of capital budgets. Those budgets freeze first and thaw last, so your worst year arrives before the wider downturn is visible, and your recovery lags everyone else’s.
2. Working capital. Demonstration stock, spare parts inventory and freight tie up cash months before any revenue arrives. Growth consumes cash in this model rather than releasing it.
3. Warranty exposure. The contract may put warranty on the manufacturer. Your customer will put it on you, and the labour cost is often yours regardless of what the paperwork says.
4. Regulatory liability. From 20 January 2027, every machine placed on the EU market must meet Regulation (EU) 2023/1230 and carry CE marking on that basis. Distributors must verify CE marking and instructions and act on suspected non-compliance. Importers must ensure documentation and correct-language instructions. Substantial modification can make you the manufacturer in law. This is not legal advice, so confirm your position with a qualified adviser in your jurisdiction.
5. Territory and channel conflict. The manufacturer selling direct into your territory, or a second distributor appearing, can erase your pipeline overnight. If exclusivity is not written down, it does not exist.
6. Single-vendor concentration. A single-line distributorship is only as stable as one manufacturer’s decisions on pricing, territory and channel. Carrying several complementary lines costs more attention to manage, and buys genuine independence in return.
7. The service trap. You cannot win the service annuity without a trained technician, and you cannot justify that salary until you have installed base. Crossing that gap is where most new distributorships fail, and it is a financing problem rather than a sales problem.
The break-even question
You will not get a break-even number from this article, because no honest one exists for this category. What you can have is the framework, and the ratio dealers actually manage to: absorption, or parts and service gross margin divided by total expenses.
Four inputs are yours to supply.
Machines per year you can realistically sell. Count the named accounts in your territory, not the market size.
Attach rate on tooling. What share of your installed base buys consumables from you rather than from somebody cheaper?
Service contract conversion. What share of installations become paid maintenance agreements?
Fixed cost floor. One technician, one salesperson, a parts stock, a demonstration machine and premises.
Then run the test. Model the business with parts and service set to zero. If it only works once the annuity is already mature, you need financing for the gap rather than optimism about closing it.
One closing instruction. Ask the manufacturer for the actual attach rates from their existing partners. A manufacturer who has those numbers to hand is a serious one.
Note: Use every benchmark here as a starting point for your own model, and validate it against real quotations before committing capital. This is general commercial information, not financial or legal advice.
For anyone who wants to go deeper, this further reading provides a much wider view.
Conclusion about Busbar Machine Distribution
Busbar machine distribution is a service business with a hardware sales channel attached, and the benchmark data from adjacent equipment sectors says so consistently. It turns profitable at the point where the annuity from parts and service outgrows the sales department, and not one quarter before.


Rate this article
Choose a rating from 1 to 5 stars.
No ratings yet