





Note: All market figures in this article are approximate estimates from third-party sources with different methodologies and scope definitions. Treat them as directional indicators, not measured facts.
If you’d rather listen than read, feel free to play the audio file below for the rest of this article.
How Big the Busbar Machine Market Actually Is
Three figures, each with its base year attached.
The broader busbar processing machine market is put at USD 1.5 billion in 2024, projected to reach USD 2.8 billion by 2033 at a CAGR of 7.5%. A narrower estimate counting only standalone busbar machines puts the 2025 market at approximately USD 500 million, growing at about 7% through 2033.
For context, the downstream busbar market it serves sits at roughly USD 16 to 22.5 billion in 2025 depending on source, growing at 4.4 to 6.0%.
Both busbar fabrication equipment market estimates come from report resellers rather than primary research. The section on conflicting forecasts below explains how much weight to give them.
The structural point survives the uncertainty. The equipment market is growing faster than the market it serves, roughly 7.5% against 5%. That is what happens when an industry shifts work in-house rather than making more of the same thing.
If you would like to explore this subject further, you can read more about it here.
What Is Driving the Growth
Is busbar demand driven by data centres or by the grid? By four drivers, and only one is the grid.
For a clearer and more complete explanation, this page goes into far more depth than we can cover in a short text.
Electricity Demand and Grid Investment
The baseline driver, steady rather than dramatic. The IEA projects global electricity demand growing approximately 3% annually through 2030.
One published analysis puts busbar penetration at around 48% in grid interconnection systems on renewable substation projects above 500 MW.
For equipment, grid work has a specific character. It drives medium- and high-current bar, which pushes buyers toward heavier machine classes rather than toward more units. One large substation order can justify a machine tier that a hundred small panels would not.
The most up-to-date information is always published on the official website, so it is worth checking there as well.

Data Centre Construction
The fastest-moving driver by a wide margin.
MarketsandMarkets projects the data centre busbar market growing from USD 1.38 billion in 2026 to USD 3.01 billion by 2032, a CAGR of 14.0%. Within it, the AI segment is forecast at 18.8%. The IEA expects data centre electricity consumption to exceed 945 TWh by 2030, more than doubling.
The mechanism is one line: rising rack power density makes cable distribution physically impractical. Bar replaces cable, and somebody has to process that bar.
Readers who want to understand the reasoning behind this will find this detailed article very useful.
Electric Vehicles and Charging Infrastructure
Two demand streams with different equipment implications.
Stratview Research estimates the EV busbar market at USD 2.9 billion in 2026, up 16.0% year on year, reaching USD 6.2 billion by 2033 at an 11.3% CAGR. The IEA recorded global EV adoption rising 21.1% year on year in 2025.
The distinction matters commercially. In-vehicle busbar production largely uses dedicated stamping and lamination equipment, so charging infrastructure is the segment that actually feeds general fabrication machines.
If this topic is completely new to you, this beginner-friendly guide is a good place to start.
Labour Cost and the Move to In-House Fabrication
The driver market reports consistently miss, and the one closest to the purchasing decision.
Manufacturers who previously subcontracted bar work bring it in-house when subcontract lead times start constraining panel delivery — not when bar volume alone justifies a machine. Delivery pressure, not tonnage, is the trigger.
This is why equipment demand outpaces bar demand. The same tonnage of bar moves onto more machines, spread across more shops, each buying its own capacity. No market report captures that mechanism, because it shows up as equipment orders rather than as material volume.
Regional Demand
The market is not evenly distributed, and the fastest-growing region is not the largest one.
Asia-Pacific
The largest region by a clear margin, driven by manufacturing capacity and grid buildout simultaneously.
China and India remain the primary growth engines through transmission expansion and smart grid programmes.
Europe
The second market, and the one where regulation rather than construction volume sets the pace.
Europe accounts for roughly 28% of global busbar systems demand. Renewable energy projects across Europe and North America together contributed about 35% of busbar machine sales growth in 2025. Germany’s demand is anchored in its manufacturing base and energy transition investment.
The practical consequence for equipment sellers: European buyers weight documentation, accuracy and certification more heavily than throughput.
North America
Smaller than Europe in share, but distinctive in what drives it.
North America represents approximately 21% of global busbar systems demand. The US busbar market is forecast to grow at a comparatively modest 3.5% CAGR through 2035, while Canada is projected to reach USD 1.1 billion by 2035. The US hosts more than 2,700 data centre facilities, and North America is the fastest-growing region for EV busbar demand.
The split is the story: infrastructure growth is slow, data centre and EV demand is not.
Middle East and Africa
The region least covered by published data, and for that reason the one worth covering carefully.
Granular figures are scarce here, so the honest approach is to describe the drivers rather than invent precision. Grid expansion across the Gulf states, industrial diversification programmes, and new generation capacity in North and East Africa all generate panel and switchgear demand.
Regional buyers frequently sit at the entry and mid machine tiers, where price sensitivity is highest and specification requirements are lightest.
Latin America
The region most likely to surprise readers.
Latin America is projected to be the fastest-growing region in the busbar market across the 2026–2035 forecast period, from a small base. Drivers are grid modernisation, renewable capacity additions and industrial electrification, with Brazil and Mexico leading.
The caveat matters more than the headline. Fastest growth from a small base still means fewer absolute machine sales than a slow-growing large market, and that distinction should decide where a sales team spends its time.
| Region | Share of busbar systems demand | Growth character | Primary driver |
|---|---|---|---|
| Asia-Pacific | ~46% | Largest and among the fastest | Manufacturing capacity plus grid buildout |
| Europe | ~28% | Moderate, regulation-paced | Decarbonisation and renewable integration |
| North America | ~21% | Slow infrastructure, fast data centre | Data centre construction and EV |
| Middle East and Africa | Not separately reported | Expanding, entry-tier weighted | Grid expansion and diversification |
| Latin America | Small base | Fastest projected rate | Grid modernisation and electrification |
What the Market Looks Like From the Machine Side
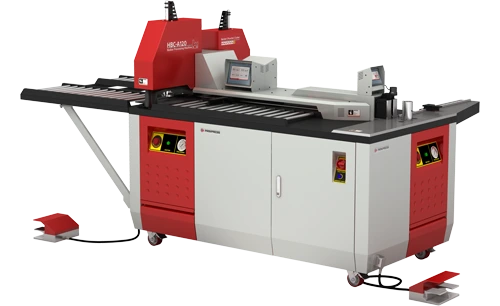
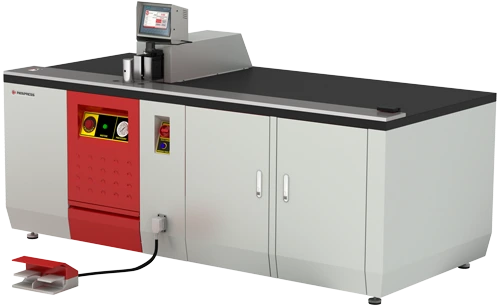
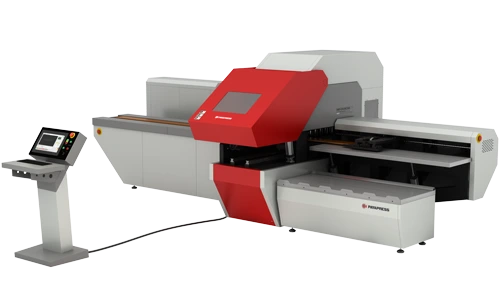
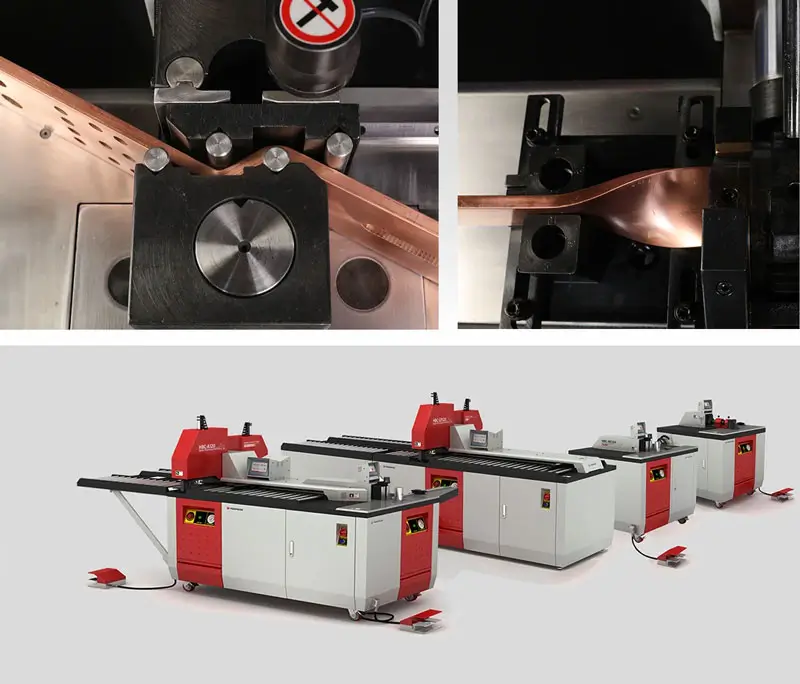
Market totals become equipment reality at the specification sheet, and this is where a market figure turns into a purchase. Demand for three-in-one machines rose approximately 12% in 2025 according to industrial trade data, which is faster than the market as a whole.
| Tier | Typical copper capacity | Punching force | Character |
|---|---|---|---|
| Entry / portable | Up to ~10–12 mm × 120 mm | ~25 tonnes | Field work, small batches, price-led |
| Mid-range | Up to ~12–15 mm × 200 mm | 25–40 tonnes | Workshop production, mixed jobs |
| Heavy-duty CNC | Up to ~16–20 mm × 250–300 mm | Up to ~60 tonnes | High volume, traceability, automation |
Capacities are vendor-published and indicative rather than standardised, so cross-vendor comparison needs care. Cutting force runs roughly 20 to 40 tonnes on general machines, though heavy sections demand considerably more — punching an M20 hole through 200 × 15 mm copper can exceed 60 tonnes on its own. Typical cycle times run 6 to 8 seconds punching, 4 to 5 cutting, and 8 to 10 bending, varying with thickness and hole size.
The trend matters more than any single figure. CNC control has displaced mechanical control across the mid and upper tiers. That raises unit prices and inflates the CNC busbar machine market value independently of unit volume.
Where the Forecasts Disagree
Published estimates range from roughly USD 500 million to USD 1.5 billion for essentially the same period. Anyone asking why do busbar market forecasts disagree deserves the actual reasons, and they are worse than scope alone.
Scope. Some count only standalone machines; others include full processing lines, CNC centres and tooling.
Boundary. Some include sheet metal and general fabrication equipment sold to the same customers.
Base year. Figures dated 2024 and 2026 are routinely presented side by side without adjustment.
And in some cases, the figures appear to be templated. One report seller publishes an identical trio — USD 1.5 billion in 2024, USD 2.8 billion by 2033, 7.5% CAGR — for two unrelated markets: busbar processing machines and aluminium busbar trunking systems. Another states USD 500 million for 2025 and USD 2 billion for 2023 on the same page, and still carries unfilled placeholder text in its title.
The rule follows directly: treat the growth rate as the signal and the absolute size as an estimate. Growth rates cluster tightly at 7 to 7.5%; totals do not cluster at all. Any busbar machine industry forecast quoting one total without a scope definition should be read with that in mind.
| Estimate | Base year | Forecast | CAGR | Scope |
|---|---|---|---|---|
| USD 1.5 bn | 2024 | USD 2.8 bn by 2033 | 7.5% | Broad: processing machines and lines |
| USD 500 m | 2025 | — | ~7% | Narrow: standalone busbar machines |
| USD 2 bn | 2023 | — | — | Stated by the same source as the USD 500 m figure |
| USD 16–22.5 bn | 2025 | — | 4.4–6.0% | Downstream busbar market, for comparison |
What the Data Means Commercially
Five rules, drawn from the figures above.
Equipment growth outpacing bar growth means the addressable market is expanding through new buyers, not just larger orders from existing ones.
Asia-Pacific leads on volume while Latin America leads on rate, so a volume strategy and a growth strategy point at different maps.
Data centre and EV demand concentrates in specific corridors rather than spreading nationally, which makes regional targeting more effective than country-level targeting.
The shift to CNC raises average selling price, so revenue growth overstates unit growth. A market growing 7.5% in value is not selling 7.5% more machines.
Entry-tier demand in emerging markets is price-led while European demand is specification-led. Busbar machine demand in each responds to different arguments.
One honest limitation closes this section: no public dataset tracks busbar machine unit shipments by country, so regional planning has to triangulate from downstream demand.
Conclusion about Busbar Machine Market Size
The busbar machine market sits somewhere between USD 0.5 and 1.5 billion depending on definition, growing at roughly 7.5% a year — faster than the busbar market it supplies.
Anyone asking which region buys the most busbar machines gets a simple answer: Asia-Pacific holds the volume. Latin America holds the growth rate. Data centres hold the momentum.
Trust the growth rate. Question the total, and question any page that gives one figure without a scope definition.



Rate this article
Choose a rating from 1 to 5 stars.
No ratings yet