



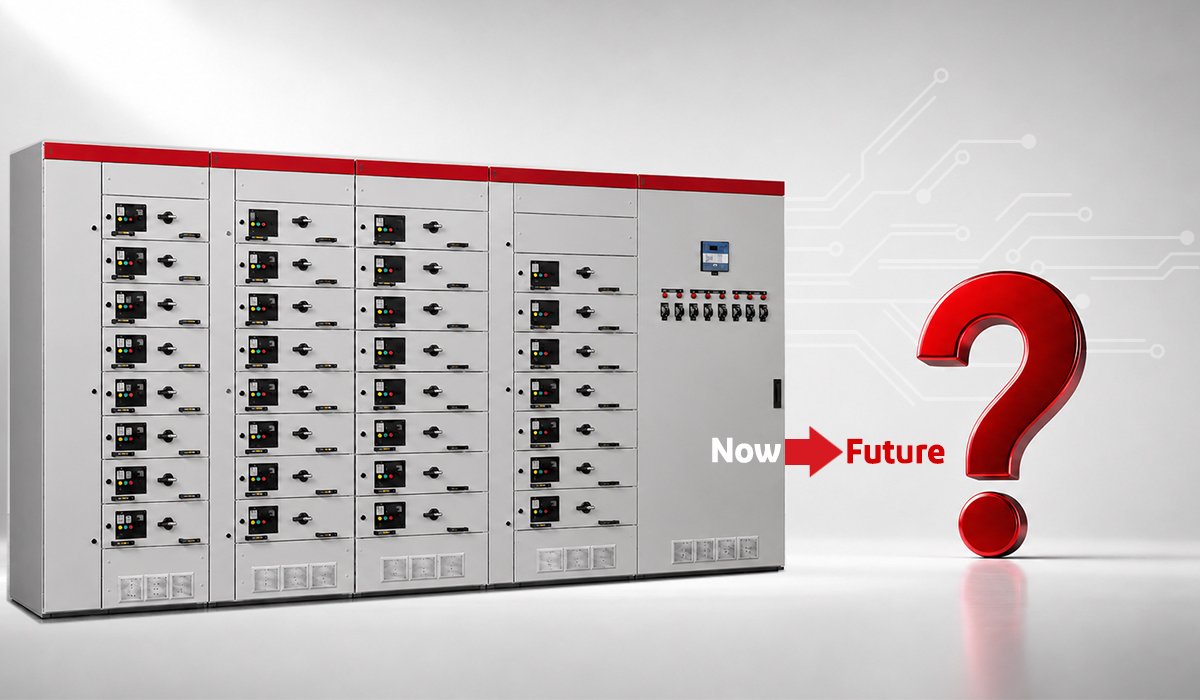

What’s Driving Innovations in Busbar Systems in 2026
Three demands are pushing busbar technology forward, and it helps to name them precisely rather than talking about digitalisation in general.
Power density. Data centre racks, EV charging plazas and battery production lines all need to move more current through less space than a cable tray can manage. This is a physical constraint, not a preference, and it is the single strongest driver of busbar adoption over cable.
Electrification of transport. Every electric vehicle contains busbars in its battery pack and drivetrain, and every fast charger contains more. This has created a busbar demand category that barely existed a decade ago, and it is growing far faster than the traditional switchgear market.
Grid decentralisation. Solar, wind and storage assets push power in both directions. Distribution equipment designed for one-way flow is being replaced by architectures that handle variable, bidirectional input.
Cost and regulation shape how manufacturers respond, but these three demands are what create the pressure. The sections below follow them through into specific technology changes, then into what the market data says about the scale of each.
This article serves as a valuable resource for those seeking detailed information on Electrical Busbars for Power Distribution Systems.
Smart Busbar Innovations: Sensors and Condition Monitoring
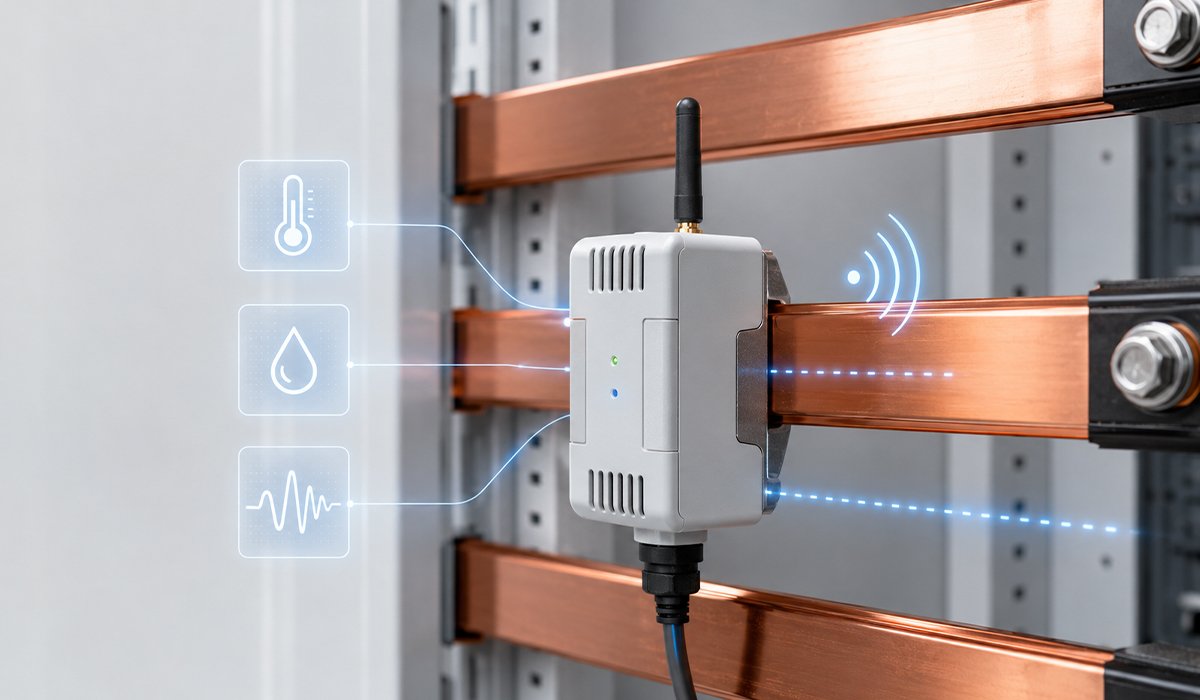
The clearest innovation in busbar systems is that the bar has started reporting on itself. Instead of a passive conductor checked once a year with a thermal camera, a monitored bar streams temperature and current data continuously.
The practical value is narrower than most marketing suggests, and it is worth being specific. Monitoring is most useful at bolted joints, because that is where busbar systems actually fail. A joint that loosens through thermal cycling develops higher contact resistance, which produces more heat, which loosens it further. That cycle runs for months before anything visible happens. A temperature sensor at the joint catches it early; an annual inspection usually does not.
What Sensor-Enabled Busbars Actually Measure
Typical instrumented systems track three things:
- Temperature at joints and terminations, which is the leading indicator of connection degradation.
- Current per phase, which shows load imbalance across a three-phase run — useful for capacity planning as much as for fault detection.
- Humidity or partial discharge in medium-voltage assemblies, where moisture ingress precedes insulation failure.
Data usually reaches the plant through wired or wireless links into an existing SCADA or building management platform, so the busbar becomes another data source rather than a separate system to manage.
Predictive Maintenance and Its Real Limits
Predictive maintenance replaces fixed inspection intervals with condition-based action. Instead of torque-checking every joint each shutdown, you check the joints the data has flagged.
Two limits are worth knowing before you invest. First, a sensor only sees what it is next to — a hotspot 300 mm from the sensor may not register at all, so placement matters more than sensor count. Second, retrofit is difficult. Most monitoring is designed into the assembly at manufacture. Adding it to an existing installed bar usually means an outage and often means new supports.
For new switchgear at high-value sites, the case is strong. For an existing panel that has run without incident for fifteen years, it is often not.
AI and Simulation in Busbar Design
Busbar design has traditionally relied on ampacity tables and standard formulas. The innovation here is the shift to solving the physics directly.
Multiphysics simulation lets engineers model current density, heating and electromagnetic force together, rather than checking each in sequence with a safety factor between them. This matters most where the standard tables stop being reliable: laminated bars, tight bends, pulsed current, and battery pack interconnects where contact resistance generates more heat than the conductor itself.
AI-assisted optimization adds a search layer on top. Instead of an engineer trying three or four cross-sections by hand, the software tests hundreds of geometry variations and returns the configuration that meets thermal limits with the least copper. On a large project, the material saving alone can justify the license.
Digital twin work is the least mature of the three. A virtual model of an installed busbar system, fed by live sensor data, allows an operator to test a capacity increase before committing to it. The concept is sound, but it depends on monitoring hardware being present, which limits it to new installations at large sites.
One caution that applies to all three: simulation output is only as good as the boundary conditions entered. A model that assumes 35 °C ambient in an enclosure that actually runs at 55 °C will confidently approve a bar that overheats.
Material and Manufacturing Innovations
Copper still dominates, but the material picture is genuinely shifting, and cost is the main reason.
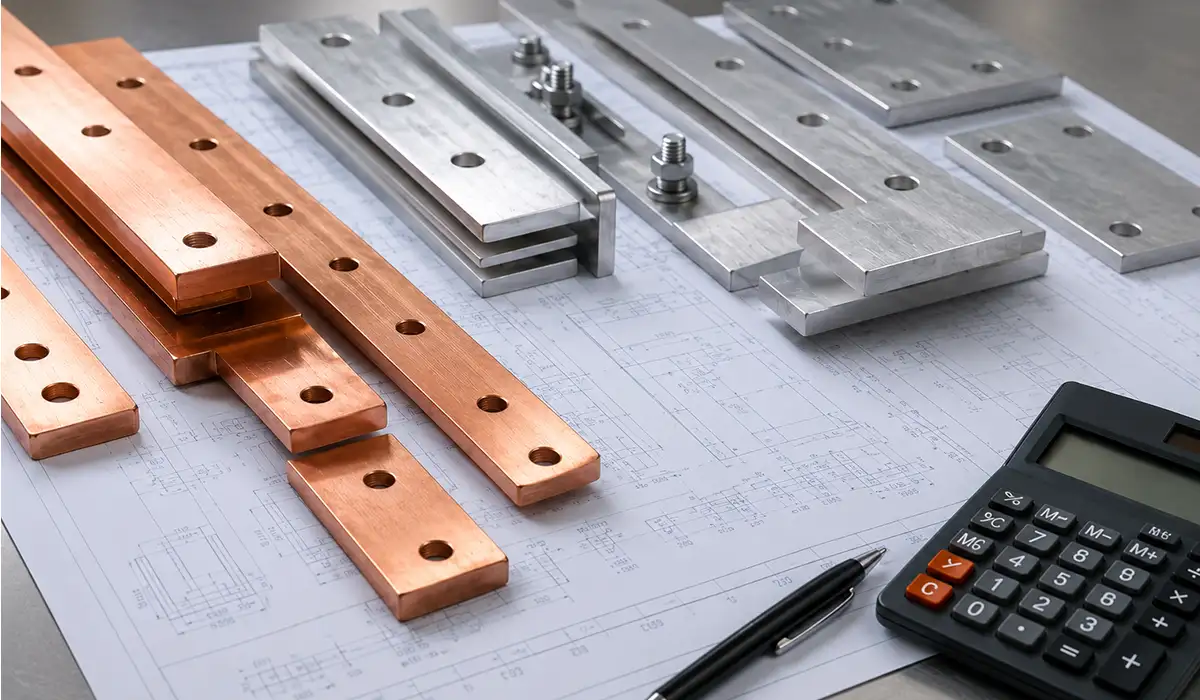
Aluminium is gaining share where weight or price matters. It carries roughly 60% of copper’s conductivity for a given cross-section, so an aluminium bar must be larger to do the same job. Where enclosure space allows, the saving is substantial at current copper and aluminium prices. In EV applications the weight advantage matters as much as the price — aluminium is around a third the density of copper. The trade-off is joint design: aluminium creeps under sustained clamping pressure and forms an insulating oxide almost immediately on exposure to air, so terminations need Belleville washers and correct surface preparation rather than the practice used for copper.
Plating has become a design decision rather than a finish. Tin remains the default for general use. Silver plating gives lower contact resistance and suits high-current joints. Nickel handles higher operating temperatures and harsher atmospheres. Choosing the wrong plating for the environment causes more field failures than choosing the wrong base metal.
Additive manufacturing is real but narrow. 3D printed conductors allow internal cooling channels and shapes that cannot be cut and bent, which is valuable in power electronics and dense battery modules. For panel busbars in the sizes most switchgear uses, cutting, punching and bending remains faster, cheaper and more consistent by a wide margin.
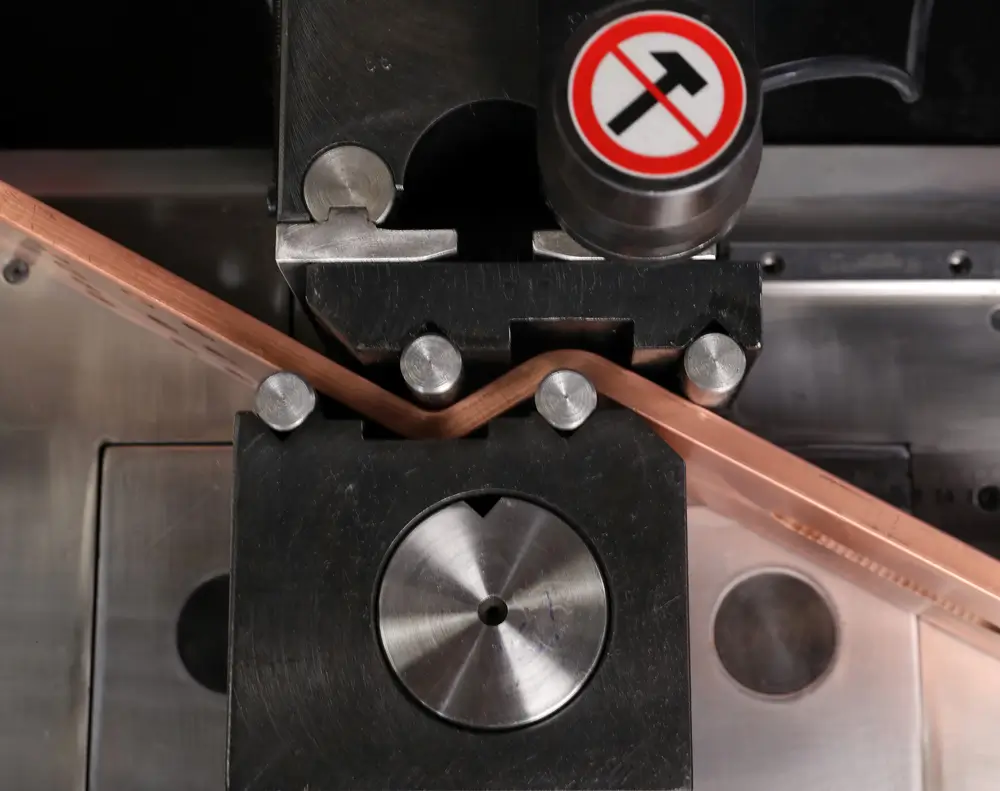
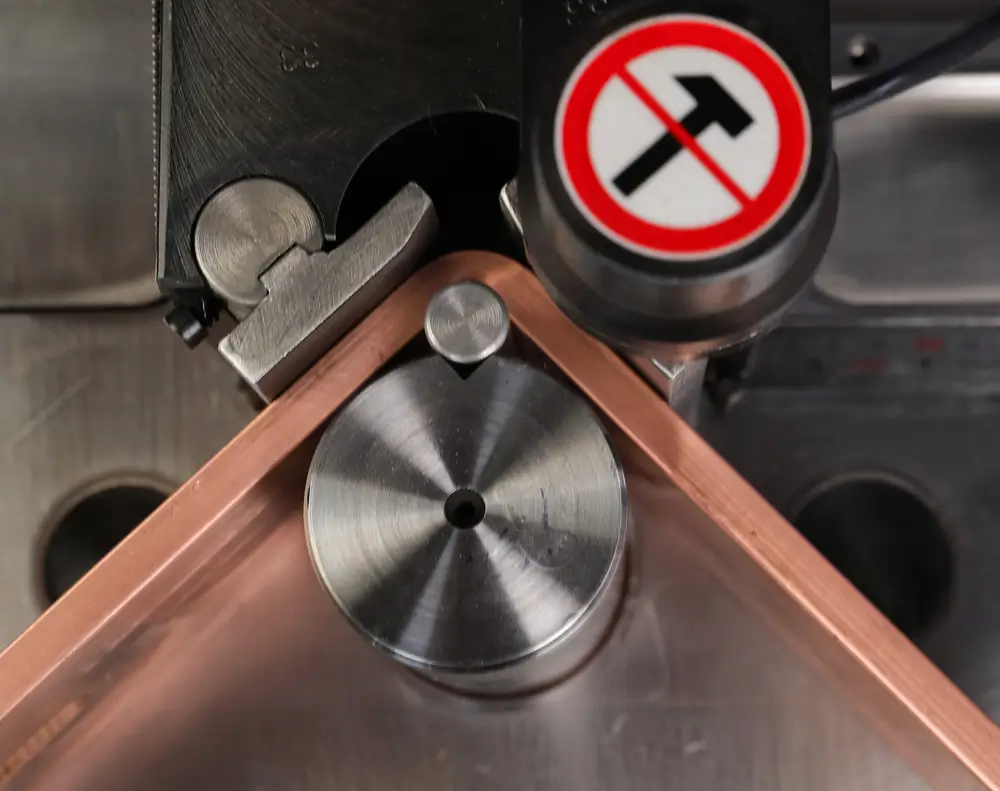
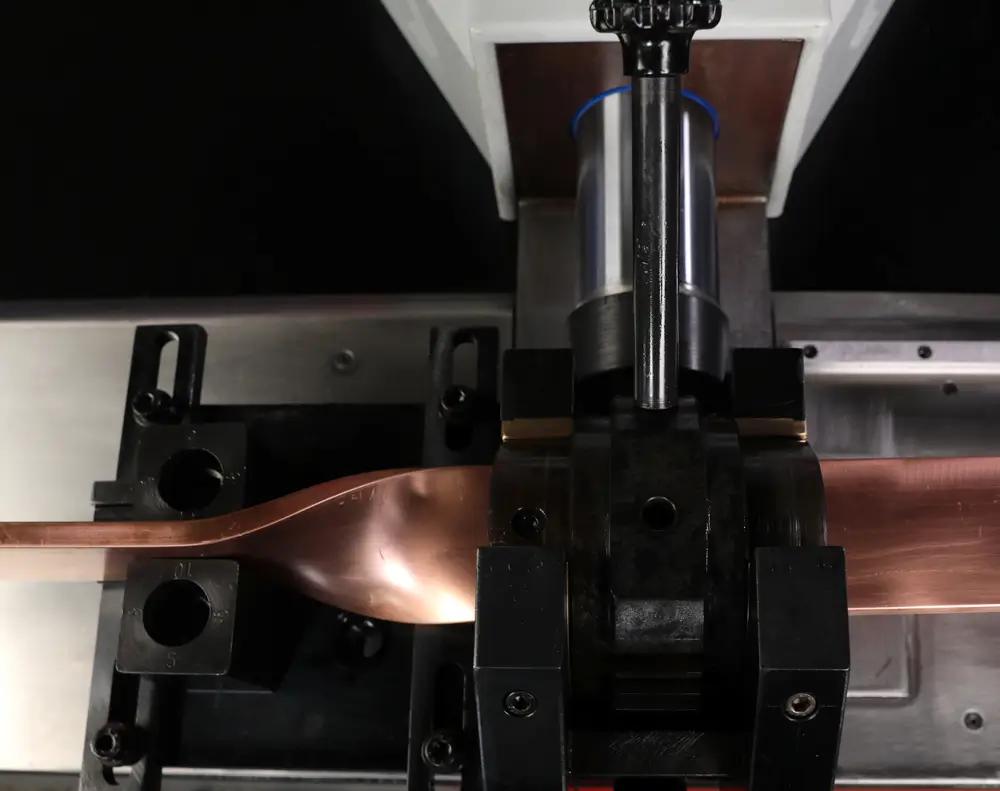
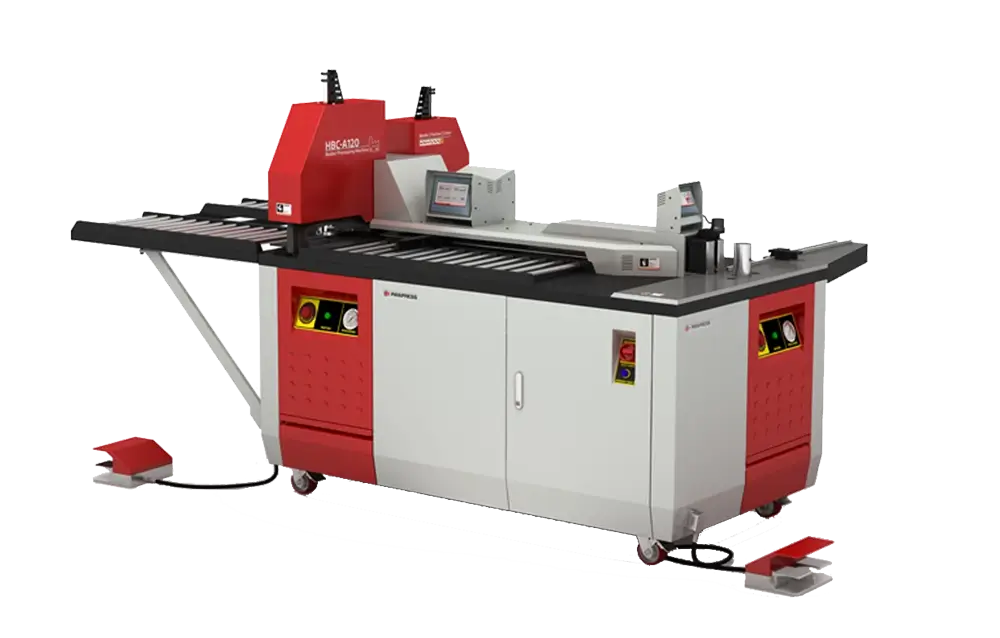
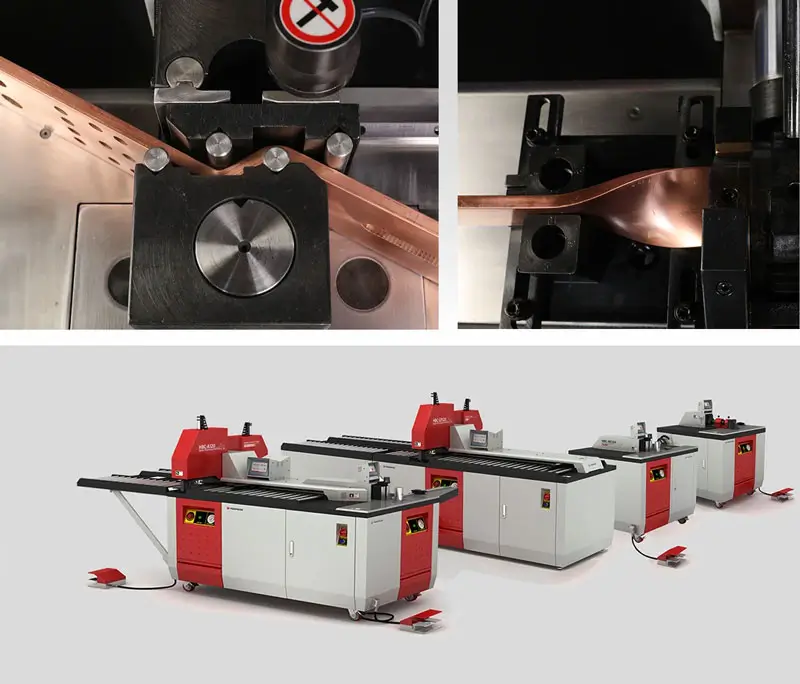
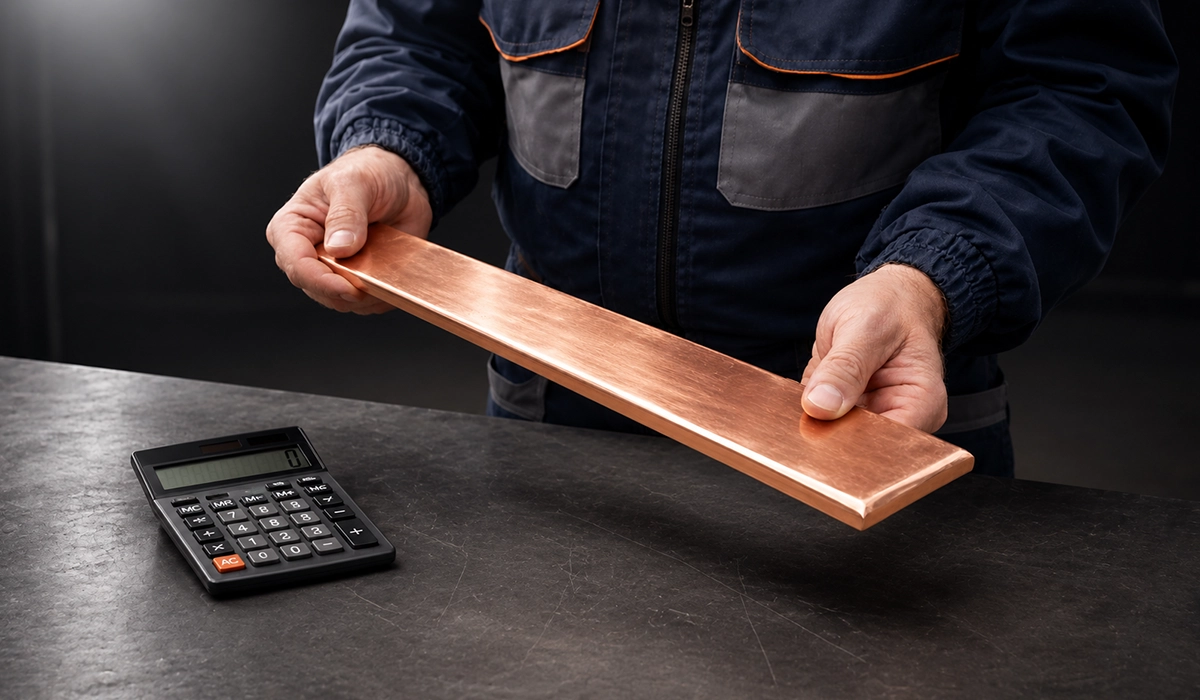
Fabrication tolerance is the constraint most people underestimate. The innovations above only deliver if the bar is made to the dimensions the design assumed. A bar bent a few millimetres out of position eliminates the clearance the simulation approved. This is why CNC processing — cutting, punching and bending in one controlled setup — has become standard practice rather than a premium option as designs get tighter.
Busbar Systems Market Size and Forecast
The busbar systems market is widely covered by research firms, and their published figures disagree sharply. Rather than repeat one number, the table below sets the main forecasts side by side.
| Source | Base Value | Forecast | CAGR |
|---|---|---|---|
| MarketsandMarkets | USD 15.10 bn (2024) | USD 19.70 bn by 2029 | 5.5% |
| Fortune Business Insights | USD 16.2 bn (2025) | USD 27.1 bn by 2034 | 5.88% |
| Data Bridge Market Research | USD 17.04 bn (2024) | USD 26.97 bn by 2032 | 5.90% |
| Business Research Insights | USD 17.01 bn (2026) | USD 25.21 bn by 2035 | 4.4% |
| Straits Research | USD 18.95 bn (2024) | USD 30.69 bn by 2033 | 5.5% |
| SkyQuest | USD 19.2 bn (2024) | USD 29.3 bn by 2033 | 4.81% |
| Market Research Future | — | USD 105.69 bn by 2035 | 17.93% |
Six of the seven cluster tightly: a market worth roughly USD 15–19 billion today, growing at 4.4% to 5.9%, reaching somewhere around USD 25–31 billion in the early 2030s. That is the figure to use for planning.
Why Busbar Market Forecasts Disagree
The seventh row is four to five times higher than the rest, and the reason is worth understanding because it affects every regional figure you will see quoted.
Market definition is the main cause. “Busbar” can mean the copper or aluminium bar itself, or it can mean the complete busbar system including enclosures, tap-off units, joints, supports and installation. The second definition produces a much larger number from the same underlying activity. Neither is wrong, but comparing figures across the two definitions is meaningless.
Segment scope is the second cause. Some reports cover only busbar trunking or busway. Market Research Future puts the busbar trunking system market at USD 6.6 billion in 2024, growing to USD 12.17 billion by 2035 at 5.72% — a much smaller and slower market than the “busbar systems” figure from the same publisher. Research and Markets, meanwhile, gives busbar trunking USD 3.72 billion in 2026 reaching USD 5.42 billion by 2030 at 9.9%. Same segment name, very different numbers.
Base year and methodology account for the rest. Technavio expresses growth as an increment rather than a total, forecasting an increase of USD 5.83 billion between 2024 and 2029 at 5.5%. That is a different kind of statement entirely and cannot be compared directly with a market-size figure.
The practical guidance: before quoting any busbar market number, check what it includes. If a forecast shows growth far above the 5–6% band, it is almost always using a broader definition rather than describing faster real demand.
Busbar Systems Market by Region
Regional figures carry the same definition problem as global ones, so the shares below are more reliable than the absolute values.
APAC Busbar Systems Market
Asia-Pacific is either the largest or the fastest-growing region in almost every forecast, though sources disagree on which. Business Research Insights gives Asia-Pacific a 46% global share, ahead of Europe at 28% and North America at 21%. Fortune Business Insights puts Asia-Pacific at approximately 34%, driven by urbanisation and industrial expansion. Technavio estimates that APAC will account for 42% of total market growth over its forecast period.
The drivers are consistent across sources: large-scale power infrastructure, manufacturing growth, government electrification programmes and heavy renewable investment. China and India dominate the volume.
Japan is a smaller but distinct market. Fortune Business Insights characterises it as emphasising reliability, compact system design and high-performance components — which reflects a construction market with severe space constraints and a manufacturing base that specifies tightly. Japan’s automotive sector, weighted toward hybrids and fuel-cell vehicles alongside battery EVs, supports steady busbar demand through an advanced supplier ecosystem
South Korea is driven mainly by battery and automotive manufacturing. Hyundai and Kia’s EV platform investment creates demand for high-performance busbars, and the country’s battery producers add pack-level interconnect demand on top of conventional distribution equipment.
North America and US Busbar Systems Market
North America is consistently described as the largest single region by value, and in some forecasts also among the fastest growing. Research and Markets identifies North America as the largest region in 2025 and expects it to be the fastest-growing over the forecast period — an unusual combination that reflects data centre construction and grid replacement running at the same time.
The US market figures illustrate the definition problem clearly. Market Research Future projects the US busbar systems market growing from USD 4,276 million in 2025 to USD 21,420 million by 2035 at around 17.4%. That growth rate is far above the global 4–6% consensus, and it comes from the same publisher whose global figure is the outlier in the table above. Treat it as reflecting a broad system-level definition, not a US market growing three times faster than everywhere else.
Three demand sources are genuine and specific: hyperscale data centre construction, ageing distribution infrastructure reaching replacement age, and EV charging deployment supported by federal funding.
Because the situation can change over time, we suggest checking the latest published information before you make a decision.
Europe and Germany Busbar Systems Market
Europe sits between the other two regions in size, at roughly a quarter to a third of the global market depending on the source. Growth here is driven less by new construction and more by replacement and grid connection work — retrofitting distribution equipment, connecting renewable generation, and meeting efficiency requirements in commercial buildings.
Germany is the largest European market and the most standards-driven. Its industrial base — automotive manufacturing, machine building, chemical plant — specifies to IEC and DIN requirements closely, and its panel-building sector is among the most automated in the world. For manufacturers, Germany is typically the hardest market to enter on price and the most rewarding on repeat specification once qualified.
Busbar in EVSE Market and High Power EV Busbars
Electric vehicles have created two busbar markets that did not meaningfully exist fifteen years ago, and both grow far faster than the traditional market.
Busbar in EVSE Market
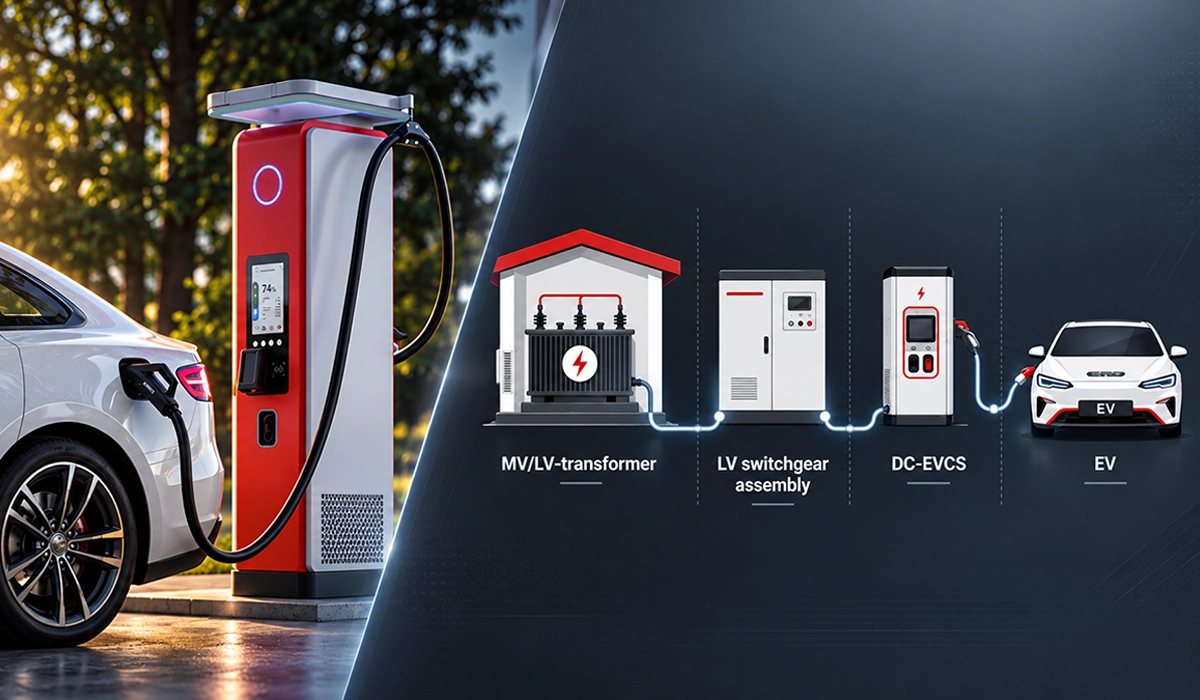
EVSE means electric vehicle supply equipment — the charging infrastructure itself. Data Bridge Market Research expects the busbar in EVSE market to reach about USD 2.66 billion by 2029 at 14.6% CAGR, driven by rising global EV adoption. Lucintel forecasts USD 2.03 billion by 2030 at 13.8%. Emergen Research gives USD 1.2 billion in 2024 rising to USD 4.8 billion by 2034 at 14.8%
These cluster around 13–15% growth, roughly three times the conventional busbar market. The technical reason is straightforward: DC fast chargers running at 150 kW to 350 kW need busbar designs that handle extreme current while managing heat and meeting safety requirements — a duty that cabling handles poorly at those levels.
Policy is a large part of the demand. The EU’s Alternative Fuels Infrastructure Regulation requires charging points along major highways at intervals of no more than 60 kilometers, and the US Infrastructure Investment and Jobs Act allocated USD 7.5 billion toward a target of 500,000 public charging points by 2030.
Within the segment, the high-current end grows fastest. Data Bridge identifies the high power category above 800 A as the dominant segment, growing at 15.0%, with epoxy powder coating leading among insulation types because it can be applied to any busbar shape.
One caveat: Market Research Future’s EVSE forecast of 3.72% CAGR sits far below every other source, which again points to a different market definition rather than a genuine disagreement about EV charging growth.
High Power EV Busbar Market
This segment covers busbars inside the vehicle — battery pack interconnects, drivetrain and inverter connections. It is smaller than EVSE in absolute terms but grows faster still.
GM Insights valued the high power electric vehicle busbar market above USD 353.3 million in 2023 with expected growth around 21.8% CAGR to 2032. The same publisher’s broader EV busbar figure runs from USD 776.1 million in 2024 to USD 5.30 billion by 2034 at 20.4%. 360iResearch takes a more conservative view, forecasting an increase of USD 1,207 million at 10.31% CAGR by 2032.
Two technical shifts matter more than the exact figure:
Busbars are becoming part of the thermal design. Conductors are increasingly tied thermally to cold plates, so the bar manages heat flow as well as current flow. This changes the geometry considerably from a simple rectangular bar.
Production philosophy is shifting toward automation and repeatability. Termination and interface design increasingly reflects line-rate production goals — reducing torque sensitivity, controlling variation, and making contact integrity easier to validate. For anyone supplying this sector, process control and qualification depth now matter as much as the part itself.
On material, copper holds the dominant position for high-power EV applications on conductivity and thermal grounds, while aluminium is expected to grow fastest because it is around 40% lighter and works well where space allows a larger cross-section for the same ampacity.
DC Busbars and Grid Integration
The move toward DC distribution is a real innovation in busbar systems, and it carries one safety implication that is often stated too briefly.
DC architectures are spreading because so many modern loads and sources are natively DC — solar arrays, battery storage, EV chargers, variable frequency drives. Every AC-DC conversion step costs efficiency, so removing conversions saves energy. Coupling power electronics directly to a busbar backplane also cuts cabling and inductance.
The safety difference is fundamental, not incremental. An AC arc extinguishes naturally at each zero crossing, 100 or 120 times per second. DC has no zero crossing, so an arc that starts will keep burning until something interrupts it. This changes busbar design in three ways: conductor spacing wider than the clearance and creepage minimums for the equivalent AC system, insulating barriers between poles, and protective devices specifically rated for DC — an AC-rated breaker used on DC may fail to clear the fault at all.
Bidirectional flow adds a second consideration. Protection schemes designed to assume power flows one way will not coordinate correctly when a solar inverter or storage system feeds current back into the bus.
Safety Innovations and Compliance Changes
Safety innovation in busbar systems is moving from containing an arc fault to detecting it before it develops energy.
Arc-resistant enclosures are the passive approach: the assembly is designed so that fault energy vents through a defined path away from anyone standing in front of it. This is now a common requirement rather than an option in medium-voltage switchgear.
Optical arc detection is the active approach. Sensors detect the light of an arc’s initial flash and trip the upstream device in a few milliseconds rather than the tens of milliseconds a conventional protection scheme needs. Because incident energy scales with clearing time, cutting the time cuts the energy released roughly in proportion.
Touch-safe construction has become standard in low-voltage distribution. Fully shrouded bars and finger-proof terminals prevent accidental contact during work on adjacent circuits.
On the compliance side, IEC and UL busbar standards continue to tighten, and manufacturers must demonstrate performance by type test rather than by calculation alone. For panel builders this has a practical consequence worth stating plainly: modifying a type-tested assembly can invalidate the test. Changing bar dimensions, support spacing or joint arrangement moves the assembly outside its verification, and the responsibility for re-verifying falls on whoever made the change.
Sustainability Innovations in Busbar Systems
Sustainability claims in this sector are often vague, so it is worth separating the ones that change a design decision from the ones that do not.
Operational loss is the largest factor by a wide margin. A busbar installation runs for twenty to forty years. Resistive loss over that period dwarfs the embodied carbon of the metal itself. Specifying a larger cross-section than the minimum increases material use but reduces I²R loss for the whole service life, and on a heavily loaded run the energy saved typically outweighs the extra copper several times over. This is the sustainability decision with real impact, and it is made at the sizing stage.
Recycled content is genuine but less decisive. Copper and aluminium both recycle without loss of conductivity, and recycled material is already common in busbar production. It lowers embodied carbon, but it does not change how the installation performs.
Modularity extends service life. A bolted, reconfigurable system can be adapted when a plant layout changes, rather than scrapped. In facilities that reconfigure often, this avoids far more material than any change in stock specification.
Design for disassembly helps at end of life. Systems that separate cleanly into metal and insulation recover more material than assemblies that must be cut apart.
If you can act on only one of these, act on the first. Busbar sizing for low loss is the decision that matters most, and the one most often skipped in favour of the minimum compliant cross-section.
Busbar Innovations Compared: Maturity and Where They Pay Off
| Innovation | Maturity in 2026 | Where It Pays Off | Main Limitation |
|---|---|---|---|
| Sensor-enabled monitoring | Commercially available | New MV switchgear, data centres, high-value sites | Hard to retrofit; sensor placement is critical |
| AI-assisted design and simulation | In routine use | Complex geometry, battery interconnects, material saving | Output only as good as the input assumptions |
| Digital twins | Early | Large sites with existing monitoring hardware | Depends on sensor data already being collected |
| Aluminium and alloy substitution | Mature | Weight-sensitive and cost-sensitive applications | Requires different joint design from copper |
| Additive-manufactured conductors | Niche | Power electronics, dense battery modules | Slower and costlier than cutting and bending at panel scale |
| DC busbar architectures | Growing fast | EV charging, storage, renewable connection | Arc suppression and DC-rated protection are mandatory |
| Optical arc detection | Established | Medium and high-voltage assemblies | Adds cost; needs coordinated protection design |
| Modular reconfigurable systems | Mature | Facilities with changing layouts | Higher initial cost than a fixed installation |
Note the column that matters: maturity. Several of these are ready to specify today, while others are still limited to specific applications. Treating them as one undifferentiated wave of innovation leads to buying the wrong thing.
What These Innovations Mean for Panel Builders
Most coverage of busbar innovation is written for specifiers. The implications for the people who actually fabricate the bars are different, and worth stating.
Tolerances are tightening. Simulation-driven designs assume the bar is made to the dimensions on the drawing. Optimized cross-sections leave less thermal margin than the conservative sizing they replace, so a fabrication error that would once have been absorbed by the safety factor now shows up as a hotspot.
Job mix is shifting toward higher volume and tighter repeatability. EV and EVSE work means many identical parts to a fixed specification, which is a different production problem from one-off switchgear. Suppliers into this sector are increasingly judged on process control and qualification depth rather than on the part alone.
Material handling is getting more varied. More aluminium, more plating variants and more laminated assemblies mean a workshop set up purely for bare copper faces more changeovers.
Documentation requirements are rising. Type-test verification and traceability push more record-keeping onto fabrication than was normal a decade ago.
The common thread is repeatability. CNC busbar processing — cutting, punching and bending in one controlled setup — has moved from being a productivity upgrade to being what these designs assume, because a manually processed bar rarely holds the tolerance that an optimized design depends on.

Rate this article
Choose a rating from 1 to 5 stars.
No ratings yet