



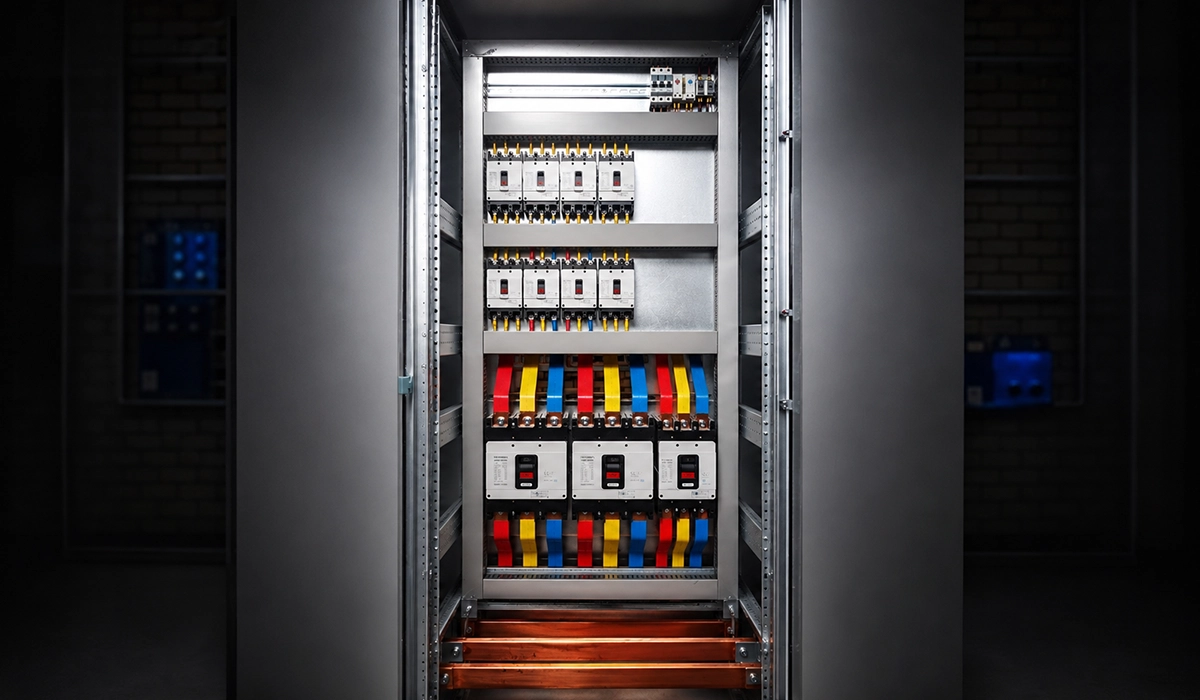

What Is Busbar Short-Circuit Withstand? Icw, Ipk and Icc Explained
Busbar short-circuit withstand is expressed through three parameters defined in IEC 61439-1. Each one answers a different engineering question, and a rating quoted without all three is incomplete.
Icw — rated short-time withstand current. This is the rms current the assembly carries for a stated duration without inadmissible deformation. It answers the thermal question. Icw is meaningless without its duration, so engineers always write it as a pair, such as 50 kA / 3 s or 85 kA / 1 s. Because the energy limit follows I²t, the same busbar carries different currents at different times. A bar rated 50 kA for 1 second withstands roughly 70.7 kA for 0.5 seconds, or 35.4 kA for 2 seconds.
Ipk — rated peak withstand current. This is the highest instantaneous current the assembly survives at the first fault peak. It answers the mechanical question, because the peak drives the electrodynamic force. Ipk follows from Icw through the factor n, which depends on the test power factor. For Icw above 50 kA, n = 2.2, so an 85 kA assembly declares 187 kA peak.
Icc — conditional short-circuit current. Here the assembly does not survive the fault on its own. An upstream current-limiting device clears it, and the manufacturer verifies the combination together. This route allows lighter busbar designs, and it covers most sub-distribution boards.
Two further values come from the fault study rather than the assembly. Ik″ is the initial symmetrical short-circuit current from IEC 60909-0. Ith is the thermal equivalent current used in adiabatic heating checks.
One common confusion is worth clearing up. Icu, the ultimate breaking capacity, belongs to circuit breakers under IEC 60947-2. A busbar carries fault current; it does not interrupt it. Never quote Icu as a busbar rating.
For a comprehensive understanding of Power Distribution Systems, we highly recommend reviewing this article.
Short-Circuit Withstand Parameter Reference Table
| Parameter | Symbol | Unit | IEC Reference | Typical Value Range |
|---|---|---|---|---|
| Rated Short-Time Withstand Current | Icw | kA (rms) | IEC 61439-1 | 10–100 kA |
| Rated Peak Withstand Current | Ipk | kA (peak) | IEC 61439-1 | 17–220 kA |
| Conditional Short-Circuit Current | Icc | kA (rms) | IEC 61439-1 | Device-Dependent |
| Thermal Equivalent Current | Ith | kA (rms) | IEC 60865-1 | ≈ Ik″ × 1.0–1.15 |
| Initial Symmetrical Short-Circuit Current | Ik″ | kA (rms) | IEC 60909-0 | Application-Specific |
Note: some regional standards, including AS/NZS 61439, write the peak withstand symbol as Icp. IEC 61439-1 uses Ipk. The two describe the same rating.
Rated Peak Withstand Current (Ipk): Why the First Peak Decides Mechanical Design
Rated peak withstand current is the mechanical half of the short-circuit rating. It matters because electrodynamic force rises with the square of instantaneous current. The single worst moment of the entire fault is therefore the first peak, not the average and not the rms value.
The peak follows from the symmetrical fault current through the peak factor κ:
ip = κ × √2 × Ik″
κ depends on the X/R ratio at the fault point per IEC 60909-0. A highly inductive network pushes κ toward 2.0, which is the practical maximum. A resistive network reduces it toward 1.0. Take κ from the protection study, never from a default assumption, because underestimating it understates every force result downstream.
Inside an assembly, IEC 61439-1 ties Ipk to the declared Icw through the factor n:
| Rated Icw (rms) | Factor n | Worked Example |
|---|---|---|
| ≤ 5 kA | 1.5 | 5 kA → 7.5 kA Peak |
| 5 < Icw ≤ 10 kA | 1.7 | 10 kA → 17 kA Peak |
| 10 < Icw ≤ 20 kA | 2.0 | 20 kA → 40 kA Peak |
| 20 < Icw ≤ 50 kA | 2.1 | 50 kA → 105 kA Peak |
| > 50 kA | 2.2 | 85 kA → 187 kA Peak |
The design point to remember: an assembly can pass its thermal check comfortably and still fail on Ipk. The two ratings stress different parts of the design. Conductor cross-section limits Icw. Support span, phase spacing, and insulator strength limit Ipk.
Why LV Switchgear Demands the Strictest Withstand Performance
High-voltage installations benefit from generous insulation gaps, lower fault current densities, and natural arc quenching in open air. Low-voltage switchgear sits at the opposite end of the design spectrum. Fault current densities run highest, phase clearances stay minimal, and the enclosure confines the arc flash energy.
A busbar that fails mechanically — even momentarily, before the upstream device clears the fault — can trigger sustained arcing, insulation flashover, and a station blackout. IEC 61439 addresses this directly: main conductors and their insulation must keep their insulating and mechanical characteristics throughout the withstand test.
If you are looking for more information about Electrical Panel, it is recommended not to miss reading this article.
Busbar structural design in LV assemblies must therefore treat mechanical withstand as a first-order constraint, not an afterthought. The cascade failure sequence is well documented. Electrodynamic force exceeds the support insulator’s rated load, the insulator fractures, the conductor deflects into an adjacent phase, and a sustained three-phase arc follows. Each step amplifies the damage.
Designing conservatively against this sequence — through correct span selection, phase spacing, and material choice — remains the most effective risk reduction available to the switchgear designer.
Further exploration of Power Distribution Boards can be found in the following recommended reading.
Busbar Thermal Withstand: The Adiabatic Check
Thermal withstand asks a different question from mechanical withstand. Can the conductor absorb the fault energy without reaching a temperature that damages it or the insulation touching it?
During a short circuit the fault clears far faster than the bar can shed heat. The calculation therefore assumes that no heat escapes at all. That assumption makes the method adiabatic, and it is deliberately conservative.
The check is the minimum cross-section rule:
A ≥ I × √t / k
Here A is the required cross-section in mm², I is the rms fault current in amperes, t is the clearing time in seconds, and k is a material constant. The k value depends on the initial and final permissible temperatures, so it is not a single number per metal. This is where most errors happen in practice.
| Conductor | Visible / Restricted Area | Normal Conditions | Fire Risk |
|---|---|---|---|
| Bare Copper | k = 228 | k = 159 | k = 138 |
| Bare Aluminium | k = 125 | k = 105 | k = 91 |
Two limits apply to this method, and both matter on real projects.
First, the adiabatic equation stays valid only for disconnection times up to 5 seconds. Beyond that, heat loss becomes significant and the result turns optimistic.
Second, and more important for panel builders: for busbars inside a verified assembly, the manufacturer’s tested short-circuit withstand rating to IEC 61439 takes precedence over a generic adiabatic check. Use the calculation for design work and screening. Use the test certificate for the declared rating.
The relationship worth memorising: because I²t stays fixed, allowable current varies with the square root of duration. Tripling the fault time from 1 s to 3 s cuts allowable current by a factor of √3. That is exactly why 50 kA / 3 s and 85 kA / 1 s describe almost the same busbar.
If you are looking for more information about Copper Busbar Current Ratings, it is recommended not to miss reading this article.
Short-Circuit Forces on Busbars: Electrodynamic Force Calculation
When fault current flows through parallel conductors, each bar generates a magnetic field around itself. That field acts on the current in the neighbouring bar and produces a Lorentz force. Currents in the same direction attract each other; currents in opposite directions repel. Engineers searching for a magnetic short circuit in a busbar are describing this effect. The fault is electrical, but the damage is magnetic and mechanical.
The force scales with the square of instantaneous current, so the first peak dominates everything. IEC 60865-1 gives the peak force for a two-phase (line-to-line) fault as:
Fm = (μ₀ / 2π) × ip² × (l / a)
Here ip is the peak short-circuit current in amperes, l is the support span in metres, and a is the centre-to-centre phase spacing in metres. The permeability constant is μ₀ / 2π = 2 × 10⁻⁷ H/m. For rectangular sections, IEC 60865-1 applies a geometry factor that converts the physical spacing into an effective spacing, because the current does not concentrate at a single line.
For a three-phase fault, apply the factor √3 / 2 = 0.866 to the conductor carrying the worst load:
Fm₃ = (μ₀ / 2π) × (√3 / 2) × ip² × (l / a)
In practice most engineers work in the kA form, which avoids the exponent errors that plague this calculation:
F = 0.2 × ip² / a (N/m), with ip in kA and a in metres
Multiply that result by the span length to get the total force on one span, then apply the 0.866 factor for the three-phase case.
IEC 60865-1 then applies two dynamic response factors: Vσ for conductor stress and VF for insulator load. Both depend on the ratio of the busbar’s natural frequency fc to the force frequency, which is twice the supply frequency — 100 Hz on a 50 Hz system. Away from resonance, Vσ approaches 1.0. Near resonance it rises sharply and multiplies the static result several times over. Take these factors from the tables in the standard rather than from an assumed multiplier.
A single-phase fault between two conductors 180° out of phase produces the worst-case loading in most LV configurations. The three-phase case spreads force across all three conductors, and the outer phases carry higher net loading than the centre phase.
This article serves as a valuable resource for those seeking detailed information on power factor.
Busbar Natural Frequency and Resonance Risk
The natural frequency of a simply supported busbar span is:
fc = (γ / l²) × √(EI / m′)
EI is the flexural rigidity, m′ is the mass per unit length, and γ depends on the support arrangement. For a single simply supported span, γ = π/2.
Deflection stays lowest when fc sits well above 100 Hz, in the stiff regime where Vσ ≈ 1.0. Near resonance, dynamic amplification generates conductor stresses and insulator loads far above the static calculation. Long substation spans with aluminium conductors face the highest risk. Shortening the span or selecting a stiffer profile are the two primary countermeasures.
From Force Calculation to Material and Section Selection
Once you have quantified the maximum force Fm, two independent structural checks follow.
First, the total conductor bending stress σtot must not exceed q × Rp0.2. Rp0.2 is the 0.2% proof strength of the conductor material, and q is the plasticity shape factor — 1.5 for rectangular sections per IEC 60865-1. That factor permits controlled outer-fibre yielding at the fault peak, which uses the post-elastic reserve without causing permanent damage.
Second, the insulator reaction force must not exceed the rated mechanical withstand force of the support clamp or post insulator.
Busbar mechanical strength therefore depends on both material and section geometry. A shallow, wide bar deflects far more than a narrow, deep bar of the same area, because the moment of inertia scales with the cube of the depth. Optimise material and geometry together, never one after the other.
Further exploration of Terminal Bus Bar can be found in the following recommended reading.
Busbar Short-Circuit Calculation: A Worked Example
The example below shows why a busbar can pass its thermal check comfortably and still fail mechanically. This is the single most common sizing mistake in LV panel design.
Given:
- Prospective fault current Ik″ = 50 kA
- Peak factor κ = 2.1, taken from the protection study
- Copper bar 80 × 10 mm, hard-drawn, one bar per phase
- Support span l = 0.6 m, phase spacing a = 0.1 m
- Fault duration t = 1 s
Step 1 — Peak current
ip = κ × √2 × Ik″ = 2.1 × 1.414 × 50 = 148.5 kA
Step 2 — Thermal check
A ≥ I√t / k = 50,000 × √1 ÷ 159 = 314 mm²
The bar provides 800 mm². It passes with more than double the margin.
Step 3 — Force per span, three-phase
F = 0.2 × ip² / a × 0.866 = 0.2 × 148.5² ÷ 0.1 × 0.866 ≈ 38.2 kN/m
Over a 0.6 m span, the total force reaches 22.9 kN — roughly 2.3 tonnes on one span.
Step 4 — Bending stress, bars mounted flat
M = F × l / 8 = 22.9 × 0.6 ÷ 8 = 1.72 kN·m
Section modulus about the weak axis: W = b·h² / 6 = 80 × 10² ÷ 6 = 1,333 mm³
σ = M / W ≈ 1,290 MPa
Hard-drawn copper gives Rp0.2 of roughly 200–300 MPa, so the permissible stress q × Rp0.2 lands between 300 and 450 MPa. The flat-mounted arrangement fails by around three times.
Step 5 — The fix: rotate the bars edgewise
Same bar, same fault, same span, but with the 80 mm dimension in the bending direction:
W = 10 × 80² ÷ 6 = 10,667 mm³
σ = 1.72 kN·m ÷ 10,667 mm³ ≈ 161 MPa. It passes comfortably.
| Configuration | Section Modulus | Bending Stress | Result |
|---|---|---|---|
| 80 × 10 Flat, 0.6 m Span | 1,333 mm³ | ≈ 1,290 MPa | Fails |
| 80 × 10 Flat, 0.3 m Span | 1,333 mm³ | ≈ 322 MPa | Marginal |
| 80 × 10 Edgewise, 0.6 m Span | 10,667 mm³ | ≈ 161 MPa | Passes |
What this demonstrates: the same conductor, the same fault, and the same span produce an eightfold difference in stress purely from orientation, because section modulus scales with the square of the depth in the bending direction. It also shows that thermal sizing alone would have approved a configuration that fails mechanically by 300%. Both checks are mandatory, and they are not interchangeable.
If you are looking for more information about Busbar Design Software, it is recommended not to miss reading this article.
Material Selection and Cross-Section Design for Mechanical Withstand
Aluminium busbar mechanical strength trails copper in proof strength. Alloy 6101-T6 reaches approximately 195 MPa and 1350-H19 approximately 165 MPa. Aluminium’s lower density partly offsets that gap, because reduced mass lowers both self-weight loading and the natural frequency denominator in dynamic calculations.
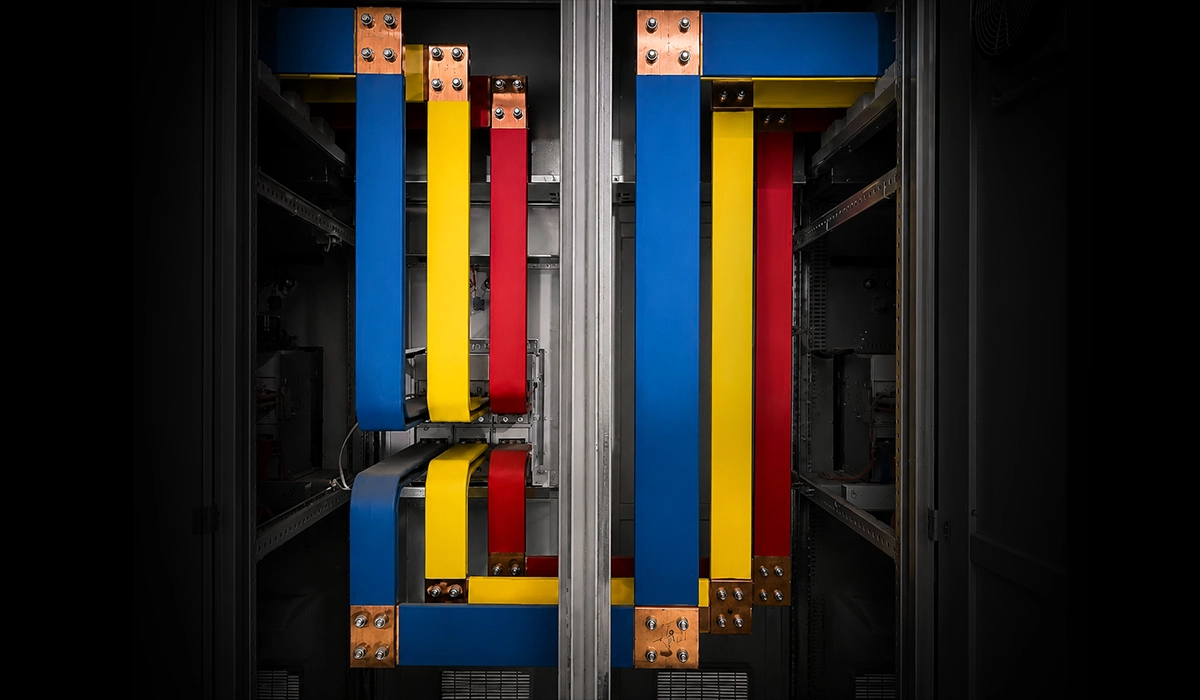
Flat rectangular conductors remain standard in LV switchgear. Two bars per phase reduce skin-effect non-uniformity at fault frequencies, which keeps the full cross-section participating in current carrying. Hollow tubular sections, usually aluminium, suit outdoor HV substations where the stiffness-to-weight ratio drives the design.
Surface treatments such as tin or silver plating reduce contact resistance at joints, but they have no measurable effect on bulk Rp0.2. Bolt class, tightening torque, and overlap length govern joint thermal performance separately from conductor mechanical withstand, and IEC 61439 guidance applies to all three.
If you are looking for more information about Flexible Busbar, it is recommended not to miss reading this article.
Copper Busbar Short-Circuit Withstand: How Temper Changes the Answer
For copper busbar short-circuit withstand, temper matters more than alloy. Soft-annealed ETP copper (C11000) offers a proof strength Rp0.2 of roughly 70–100 MPa. Hard-drawn copper reaches 200–300 MPa. That is close to a threefold difference in mechanical capacity from the same metal at the same cross-section.
Thermally, temper changes almost nothing. The adiabatic k value depends on conductivity and heat capacity, not on work hardening. Specifying hard-drawn copper therefore improves the Ipk side of the rating while leaving Icw essentially unchanged.
The procurement lesson: temper belongs on the purchase order, not just the material grade. Panel builders who specify only “ETP copper” can receive annealed bar and lose two-thirds of their mechanical margin without any visible change to the delivered product.
Busbar Material Comparison Table
| Property | Copper (ETP C11000) | Aluminium (6101-T6) | Notes |
|---|---|---|---|
| Conductivity (MS/m) | 58 | 34 | Cu ~1.7× Higher |
| Density (kg/m³) | 8 900 | 2 700 | Al ~3.3× Lighter |
| Yield Strength Rp0.2 (MPa) | 70–300 (Temper-Dependent) | 195 | Cu Hard-Drawn Superior |
| Temperature Coefficient of Resistance (×10−3/K) | 3.93 | 4.03 | Very Similar |
| Coefficient of Thermal Expansion (×10−6/K) | 16.5 | 23 | Al Expands ~40% More |
| Typical Icw Suitability | Up to 100 kA / 1 s | Up to ~85 kA / 1 s | Geometry-Dependent |
| Surface Treatment | Tin / Silver Plating | Tin / Chromate | Contact Resistance Only |
| Relative Cost Index | High | Low–Medium | Al Preferred for Long Runs |
Selection rule: choose copper when the panel is compact, the fault level exceeds 50 kA, or joint count is high. Choose aluminium when the run exceeds roughly 10 m, weight governs the support structure, or material cost dominates the tender. Expansion difference matters on long runs: aluminium moves about 40% more than copper over the same temperature swing, so allow for it at fixed anchor points.
IEC Standards Governing Busbar Short-Circuit Withstand and Mechanical Design
The IEC framework for busbar short-circuit withstand involves four interlocking documents, and each has a defined role.
IEC 60909-0 is the input standard. It provides the methods to calculate Ik″ and ip from network impedance. IEC 60865-1 is the design calculation standard. It converts those current values into electromagnetic forces and fault energy, then checks them against structural and temperature limits. IEC 61439 is the assembly compliance standard. It requires original manufacturers to verify and declare the ratings for their switchboard designs. IEC 62271-1 extends the framework to medium- and high-voltage switchgear.
IEC 60865-1 was substantially revised in 2011 to include automatic reclosure effects, mid-span dropper influence, and vertical cable-connection forces. The 1993 edition covered none of these. Engineers running older software should confirm which edition their calculation engine references, because results derived under the 1993 methodology may be non-conservative for reclosing applications.
For a comprehensive understanding of Ground Bus Bar, we highly recommend reviewing this article.
IEC 60865-1: Calculation of Short-Circuit Effects
IEC 60865-1:2011 covers rigid conductors and flexible conductors in AC systems. Rigid conductors include flat and tubular busbars. Flexible conductors include dropper cables and overhead lines. The standard applies to AC systems only — DC auxiliary busbars fall under IEC 61660-2.
For rigid arrangements the calculation sequence runs: determine ip, compute Fm, apply the Vσ and VF dynamic factors, then check that σtot ≤ q × Rp0.2 and that the insulator load stays below its rated withstand force.
IEC 61439: Assembly Verification for Short-Circuit Withstand
IEC 61439 places verification responsibility squarely with the original manufacturer. The standard exempts assemblies where Icw stays at or below 10 kA rms, and those where a current-limiting device holds cut-off current at or below 17 kA. That exemption releases most sub-distribution boards from full type-test obligation.
For main busbars in primary switchboards, common declared values are 50 kA / 3 s and 85 kA / 1 s, with a corresponding peak withstand of 187 kA. A separate loss-of-service-continuity test confirms that functional units in adjacent compartments stay operable after a contained internal fault.
IEEE 605: Guidance for HV Busbar Short-Circuit Withstand
IEEE 605 serves as the North American complement to IEC 60865-1. Verification requires evaluation across eight criteria: continuous current capacity, short-circuit rating, voltage gradient, thermal expansion accommodation, total vectorial electromagnetic force, maximum permissible span, support insulator rated strength, and vibration damper requirements for long outdoor spans.
Unlike IEC 60865-1, IEEE 605 publishes explicit span tables for standard conductor profiles. Those tables speed up preliminary sizing considerably on North American projects.
Which IEC Standard Applies to Busbar Sizing for Short-Circuit Duty?
No single standard covers busbar sizing on its own. Four documents work together:
- IEC 60909-0 — the input. Calculates Ik″ and ip from network impedance.
- IEC 60865-1 — the design calculation. Converts current into force and fault energy.
- IEC 61439-1 — the assembly verification. Governs the declared Icw, Ipk, and Icc.
- IEC TR 60890 — continuous temperature rise, used for normal-load sizing rather than fault duty.
Note the split clearly. Fault sizing and continuous-current sizing are separate exercises governed by separate standards. The final busbar is the larger of the two results. For the continuous-current side of the calculation, see our busbar sizing guide.
Practical Design Guidelines for Busbar Mechanical Strength in Switchgear
Busbar sizing for short-circuit mechanical withstand starts with span selection. Because force is proportional to l × ip² / a, the support span is the most powerful lever available. Halving the span halves the total force on that span.
Phase spacing is the second lever, and doubling it halves the force. Minimum clearance and creepage requirements per IEC 61439-1 and IEC 60664-1 set the limit on how far you can go.
Orientation comes next, and the terminology deserves care. What matters here is the plane in which the phases sit, not the direction the busbar runs through the panel. When the three phases sit side by side in a horizontal plane, the inter-phase force acts horizontally while gravity acts vertically, so the two do not add. When the phases stack vertically, the electromagnetic force and the conductor’s own weight share the same axis.
In practice the gravitational contribution is small. A 80 × 10 mm copper bar weighs roughly 70 N/m, against electromagnetic forces that reach tens of kN/m during a fault. The stacked arrangement still deserves attention, because the load path concentrates on the lower support insulators and because access for inspection is usually worse.
Further exploration of What is a busbar? can be found in the following recommended reading.
Why Busbars Fail Under Fault: Root Causes and Prevention
Most short-circuit failures trace back to a small number of decisions made early in design. The table below maps each failure mode to its root cause and the specific action that prevents it.
| Failure Mode | Root Cause | Preventive Decision |
|---|---|---|
| Permanent Bar Deformation | Span Too Long for the Peak Force | Reduce Span, or Rotate the Bar Edgewise to Raise Section Modulus |
| Support Insulator Fracture | Insulator Rated Force Below the Calculated Reaction | Check Insulator Rating Against VF-Corrected Load, Not Static Force |
| Phase-to-Phase Flashover | Deflection Closes the Air Gap Mid-Fault | Verify Dynamic Deflection, Not Just Stress |
| Amplified Stress at Moderate Fault Levels | Natural Frequency Near 100 Hz | Shift fc Well Above 100 Hz by Shortening Span or Stiffening the Profile |
| Joint Overheating After a Fault | Bolt Relaxation from Repeated Force Cycles | Specify Locking Hardware, Then Re-Torque After Any Through-Fault Event |
| Mechanical Margin Lost Silently | Annealed Bar Supplied Against a Grade-Only Specification | State Temper (Hard-Drawn) Explicitly on the Purchase Order |
How to Improve Busbar Mechanical Rigidity in Switchgear
Improving rigidity comes down to three techniques.
Install stiffening spacers between parallel bars to suppress lateral deflection between supports. Increase bar depth rather than width, because the moment of inertia follows I = b·h³ / 12 and depth enters as a cube. Specify hollow tubular profiles for outdoor HV spans, where weight and aeolian vibration interact with short-circuit fatigue.
Double-bar configurations per phase add a further benefit. They reduce skin-effect non-uniformity at fault frequencies, which ensures the full cross-section participates in both current carrying and force generation. That removes a non-conservative assumption from single-bar calculations.
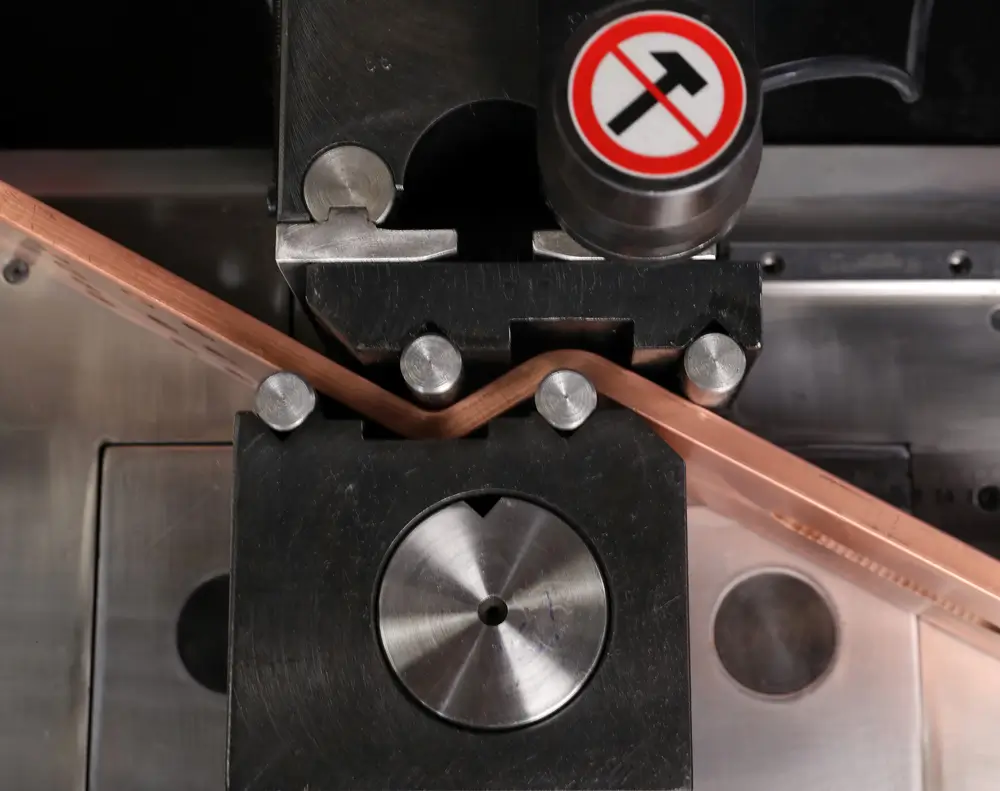
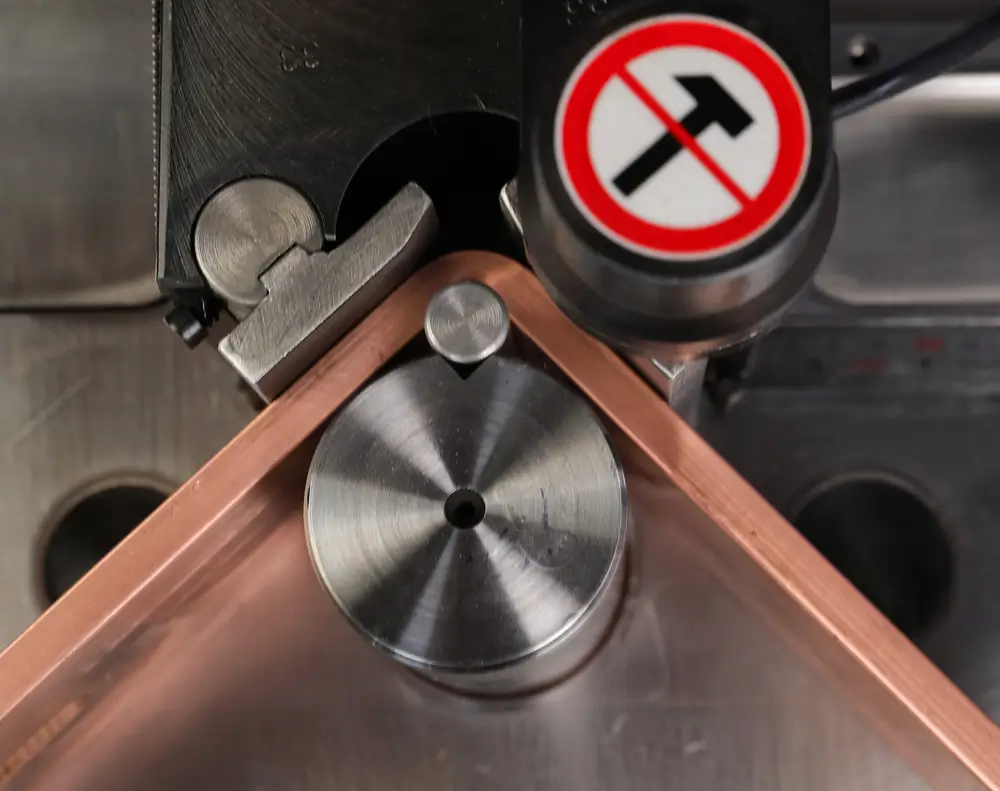
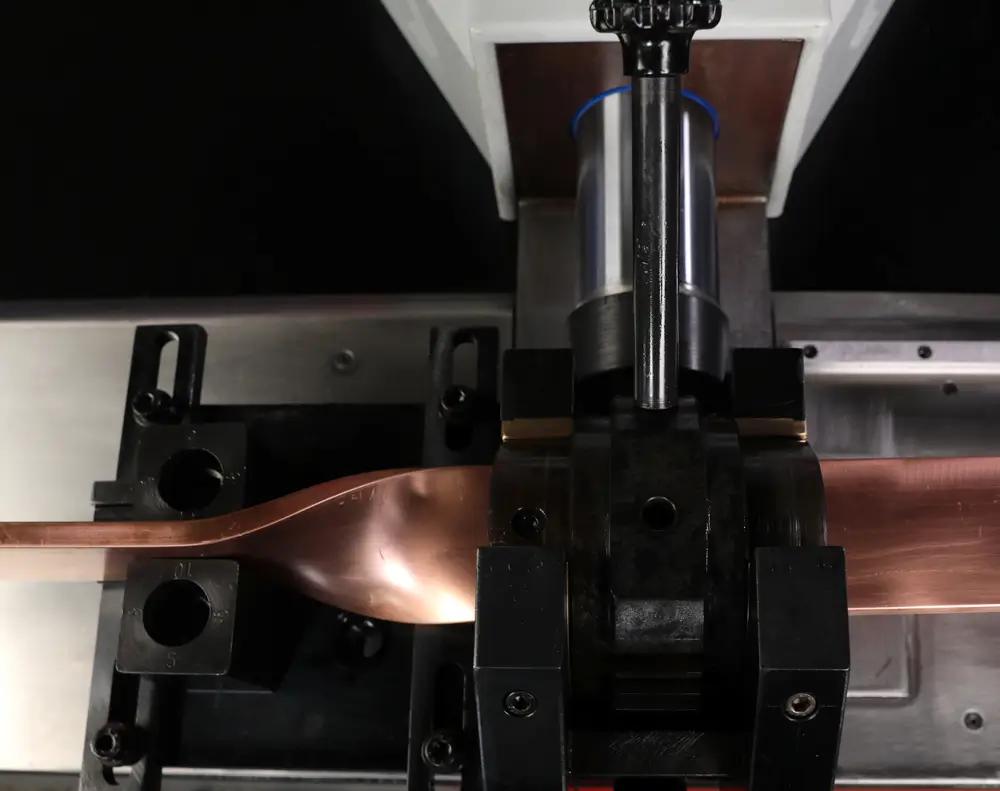
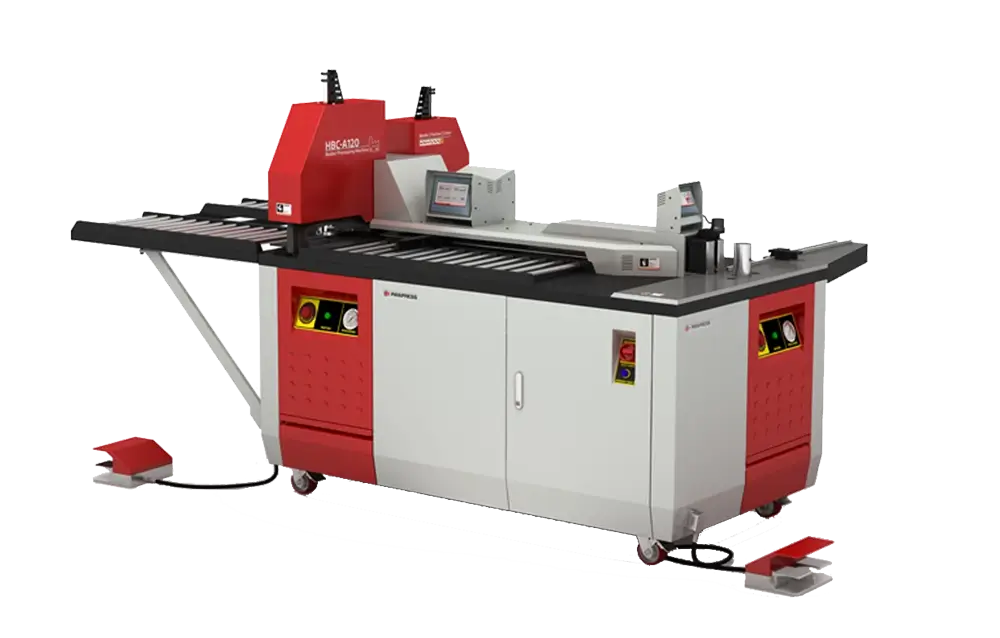
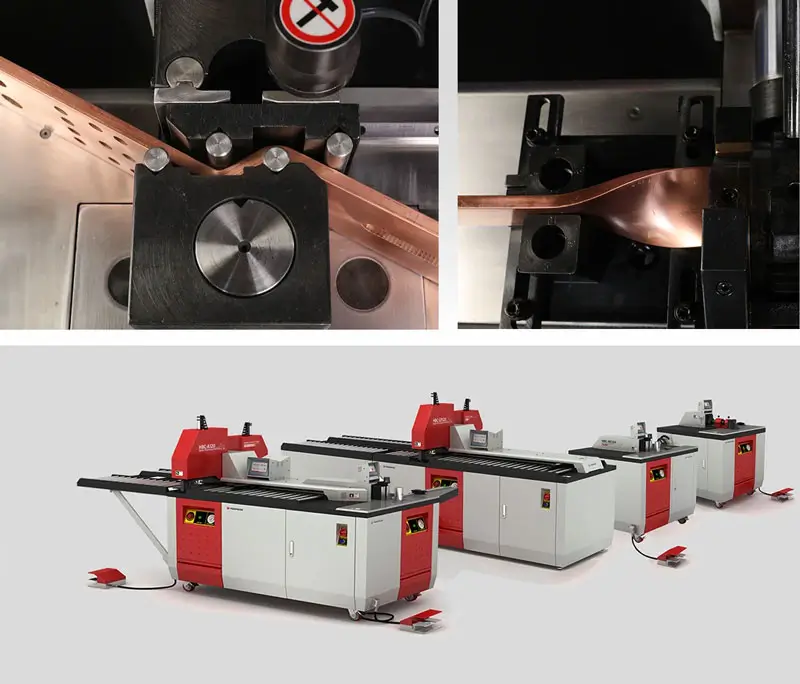
A Busbar Bending Machine supports reliable switchgear fabrication by producing accurately shaped copper or aluminium busbars that hold proper spacing, alignment, and mechanical strength under fault conditions. Because short-circuit withstand depends on geometry, support span, phase clearance, and connection quality, precise bending reduces stress points, avoids deformation, and ensures the busbar fits correctly within low-voltage assemblies. For manufacturers working to IEC 61439 and IEC 60865-1, a dedicated bending machine improves repeatability and supports stronger short-circuit performance.
Short-Circuit Withstand Testing: Verification and Type Test Requirements
Short-circuit withstand testing validates analytical calculations under controlled laboratory conditions. IEC 61439 recognises three verification routes: type testing, calculation per IEC 60865-1, and assessment against an existing type-tested reference design.
Type testing proceeds by closing onto a pre-set fault current and sustaining it for the rated duration, either 1 s or 3 s. Inspectors then check for inadmissible permanent deformation, insulation failure, or any change in dielectric properties under the subsequent voltage test.
Laboratories have documented insulating support rupture during tests that exceeded the rated Icw, and underestimating the dynamic amplification factor near resonance is a recognised cause. Circuit breakers and adjacent components are evaluated at the same time, because arc emission during the fault can carbonise insulation surfaces and degrade dielectric strength well outside the primary fault path.
Specialised facilities provide calibrated fault generators that reproduce peak currents up to 250 kA with accurate X/R control. That capability lets manufacturers validate performance beyond standard type-test configurations.
Calculation-based verification per IEC 60865-1 is accepted for assemblies derived from a verified design family, provided the calculation fully accounts for as-built geometry. It is not a shortcut. The calculation must be as rigorous as the test it replaces.
Further exploration of Future Trends in Busbar Systems can be found in the following recommended reading.
Conclusion
Busbar short-circuit withstand design demands compliance with thermal, electrodynamic, and materials constraints at the same time. None of them can be satisfied in isolation. Peak current magnitude, support span geometry, conductor section, and material proof strength together decide whether an assembly survives a fault intact.
The worked example in this article makes the point concretely. A bar with more than double the required thermal margin still failed mechanically by roughly three times, and a change of orientation alone brought it back inside limits. Thermal sizing tells you almost nothing about mechanical survival.
Two decisions now sit within reach. First, size the conductor from the larger of the thermal and mechanical results, never from the thermal check alone. Second, treat span, phase spacing, and bar orientation as primary design variables rather than layout details, because they move the force result far more than conductor area does.



Rate this article
Choose a rating from 1 to 5 stars.
No ratings yet