
For your convenience, if you prefer listening, you can listen to the rest of this article via the audio file below.
What Is a Busbar and Why Does Sizing Matter?
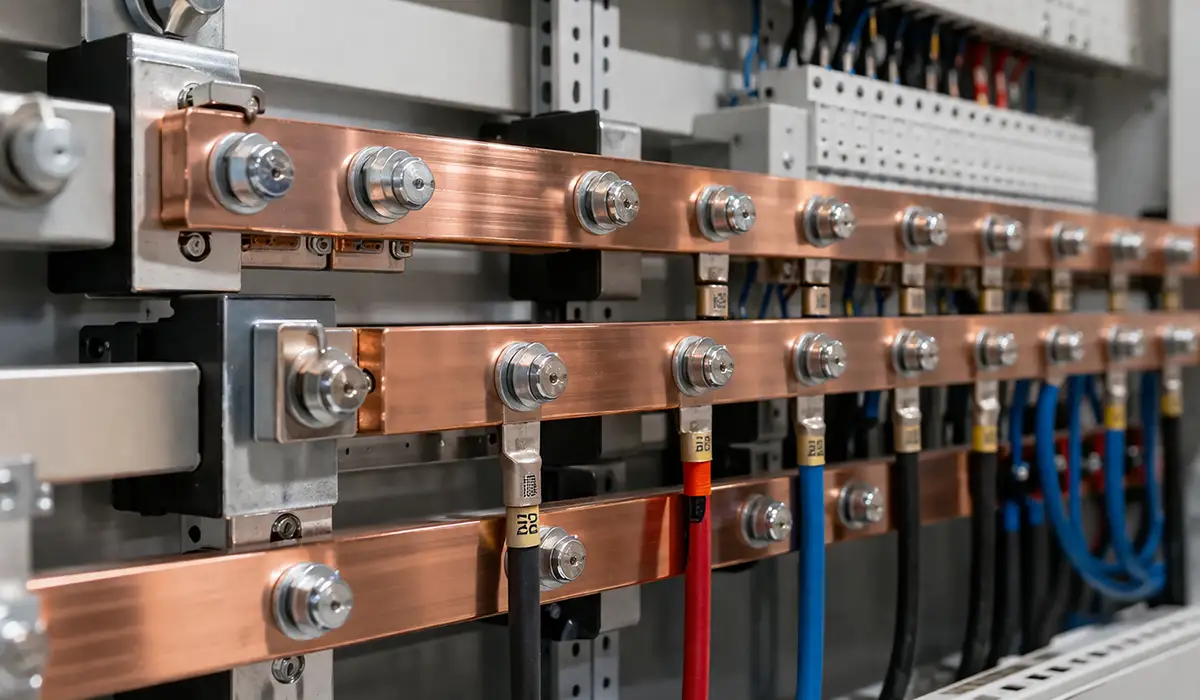
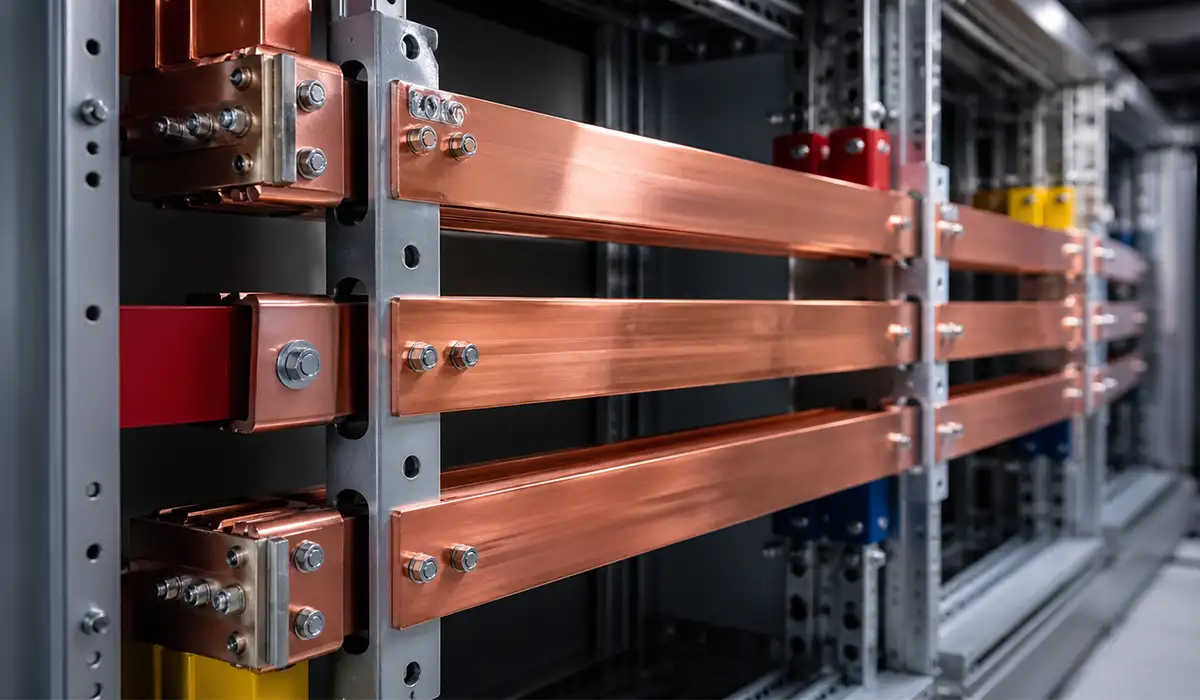
A busbar (also written bus bar or bus-bar) is a metallic conductor bar — typically copper or aluminium— that collects and distributes electric current within low-voltage (LV) switchgear, distribution boards, and industrial power panels. Unlike cables, a busbar has a defined rectangular or tubular cross-section optimized for high-current power distribution in confined equipment enclosures.
Sizing matters because every conductor obeys Joule heating: the power dissipated as heat equals I²R. If cross-sectional area is too small, resistance rises, heat generation exceeds heat dissipation, and thermal elevation climbs beyond allowable limits. The consequences include insulation degradation, contact resistance growth at terminals, accelerated ageing, and — in severe cases — arc flash or fire.
The key physical parameters that govern conductor sizing are: material (copper vs. aluminium), cross-sectional area, surface finish (bare vs. tinned vs. painted), mounting orientation (horizontal flat vs. edgewise), and enclosure ventilation. Ignoring any one of these factors produces an undersized or mis-derated design. Proper electrical conductor sizing must account for all of them simultaneously.
Engineers must therefore treat busbar dimensioning as a thermal management problem, not merely an Ohm’s Law exercise. The allowable temperature rise — not the peak current alone — is the binding constraint.
If you are looking for more information about busbar power distribution, it is recommended not to miss reading this article.
Copper vs Aluminium Busbars: Size, Current Rating & Current-Carrying Capacity
Material selection is the first engineering decision in busbar design. Copper offers an electrical conductivity of approximately 58 MS/m, versus 35 MS/m for aluminium — roughly 65 % of copper’s value. This means an aluminium conductor bar requires a larger cross-sectional area to carry the same current, typically by a factor of 1.5–1.6× in cross-section.
The copper vs. aluminium busbar current rating comparison table below summarizes the key differentiators. Copper is preferred where current density is the dominant constraint and enclosure space is limited; aluminium is selected where weight, installed cost, and corrosion in coastal environments drive the decision. Thermal expansion is higher for aluminum (23 μm/m·K vs. 17 μm/m·K for copper), requiring expansion joints in long runs.
For a comprehensive understanding of flexible busbar sizing, we highly recommend reviewing this article.
Table 1 — Copper vs. Aluminium Busbar Property Comparison
| Copper (Cu) | Property |
|---|---|
| 58 MS/m | Electrical Conductivity |
| 1.72 μΩ·cm | Resistivity (20 °C) |
| 1.4–1.8 A/mm² | Typical Ampacity per mm² |
| 8 960 kg/m³ | Density |
| 1.0 (Reference) | Relative Cost Index |
| 17 μm/m·K | Thermal Expansion Coeff. |
| Good (Patina) | Corrosion Resistance |
| A – F | Typical Insulation Class |
Note: Ampacity per mm² values assume flat bar, horizontal, free air, 35 °C ambient, 70 K temperature rise.
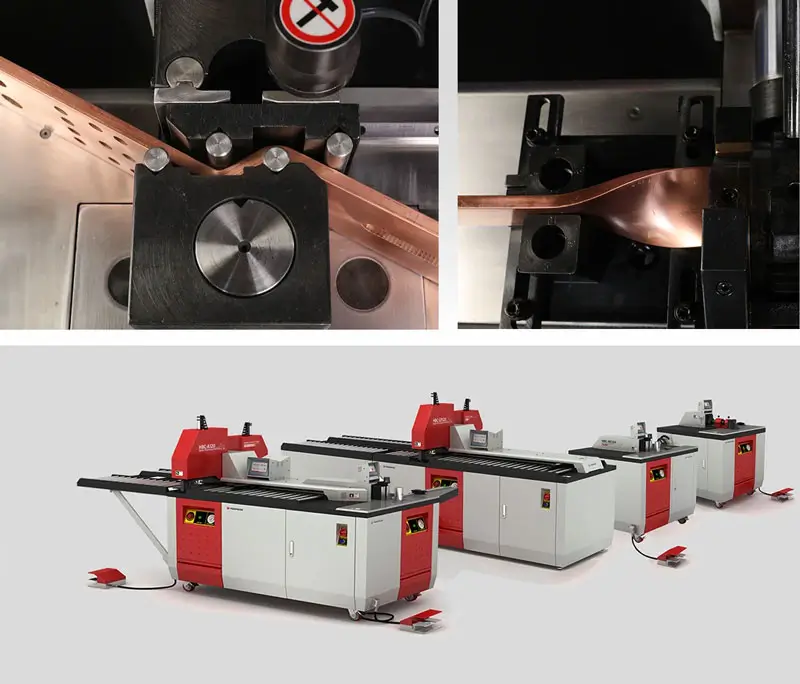
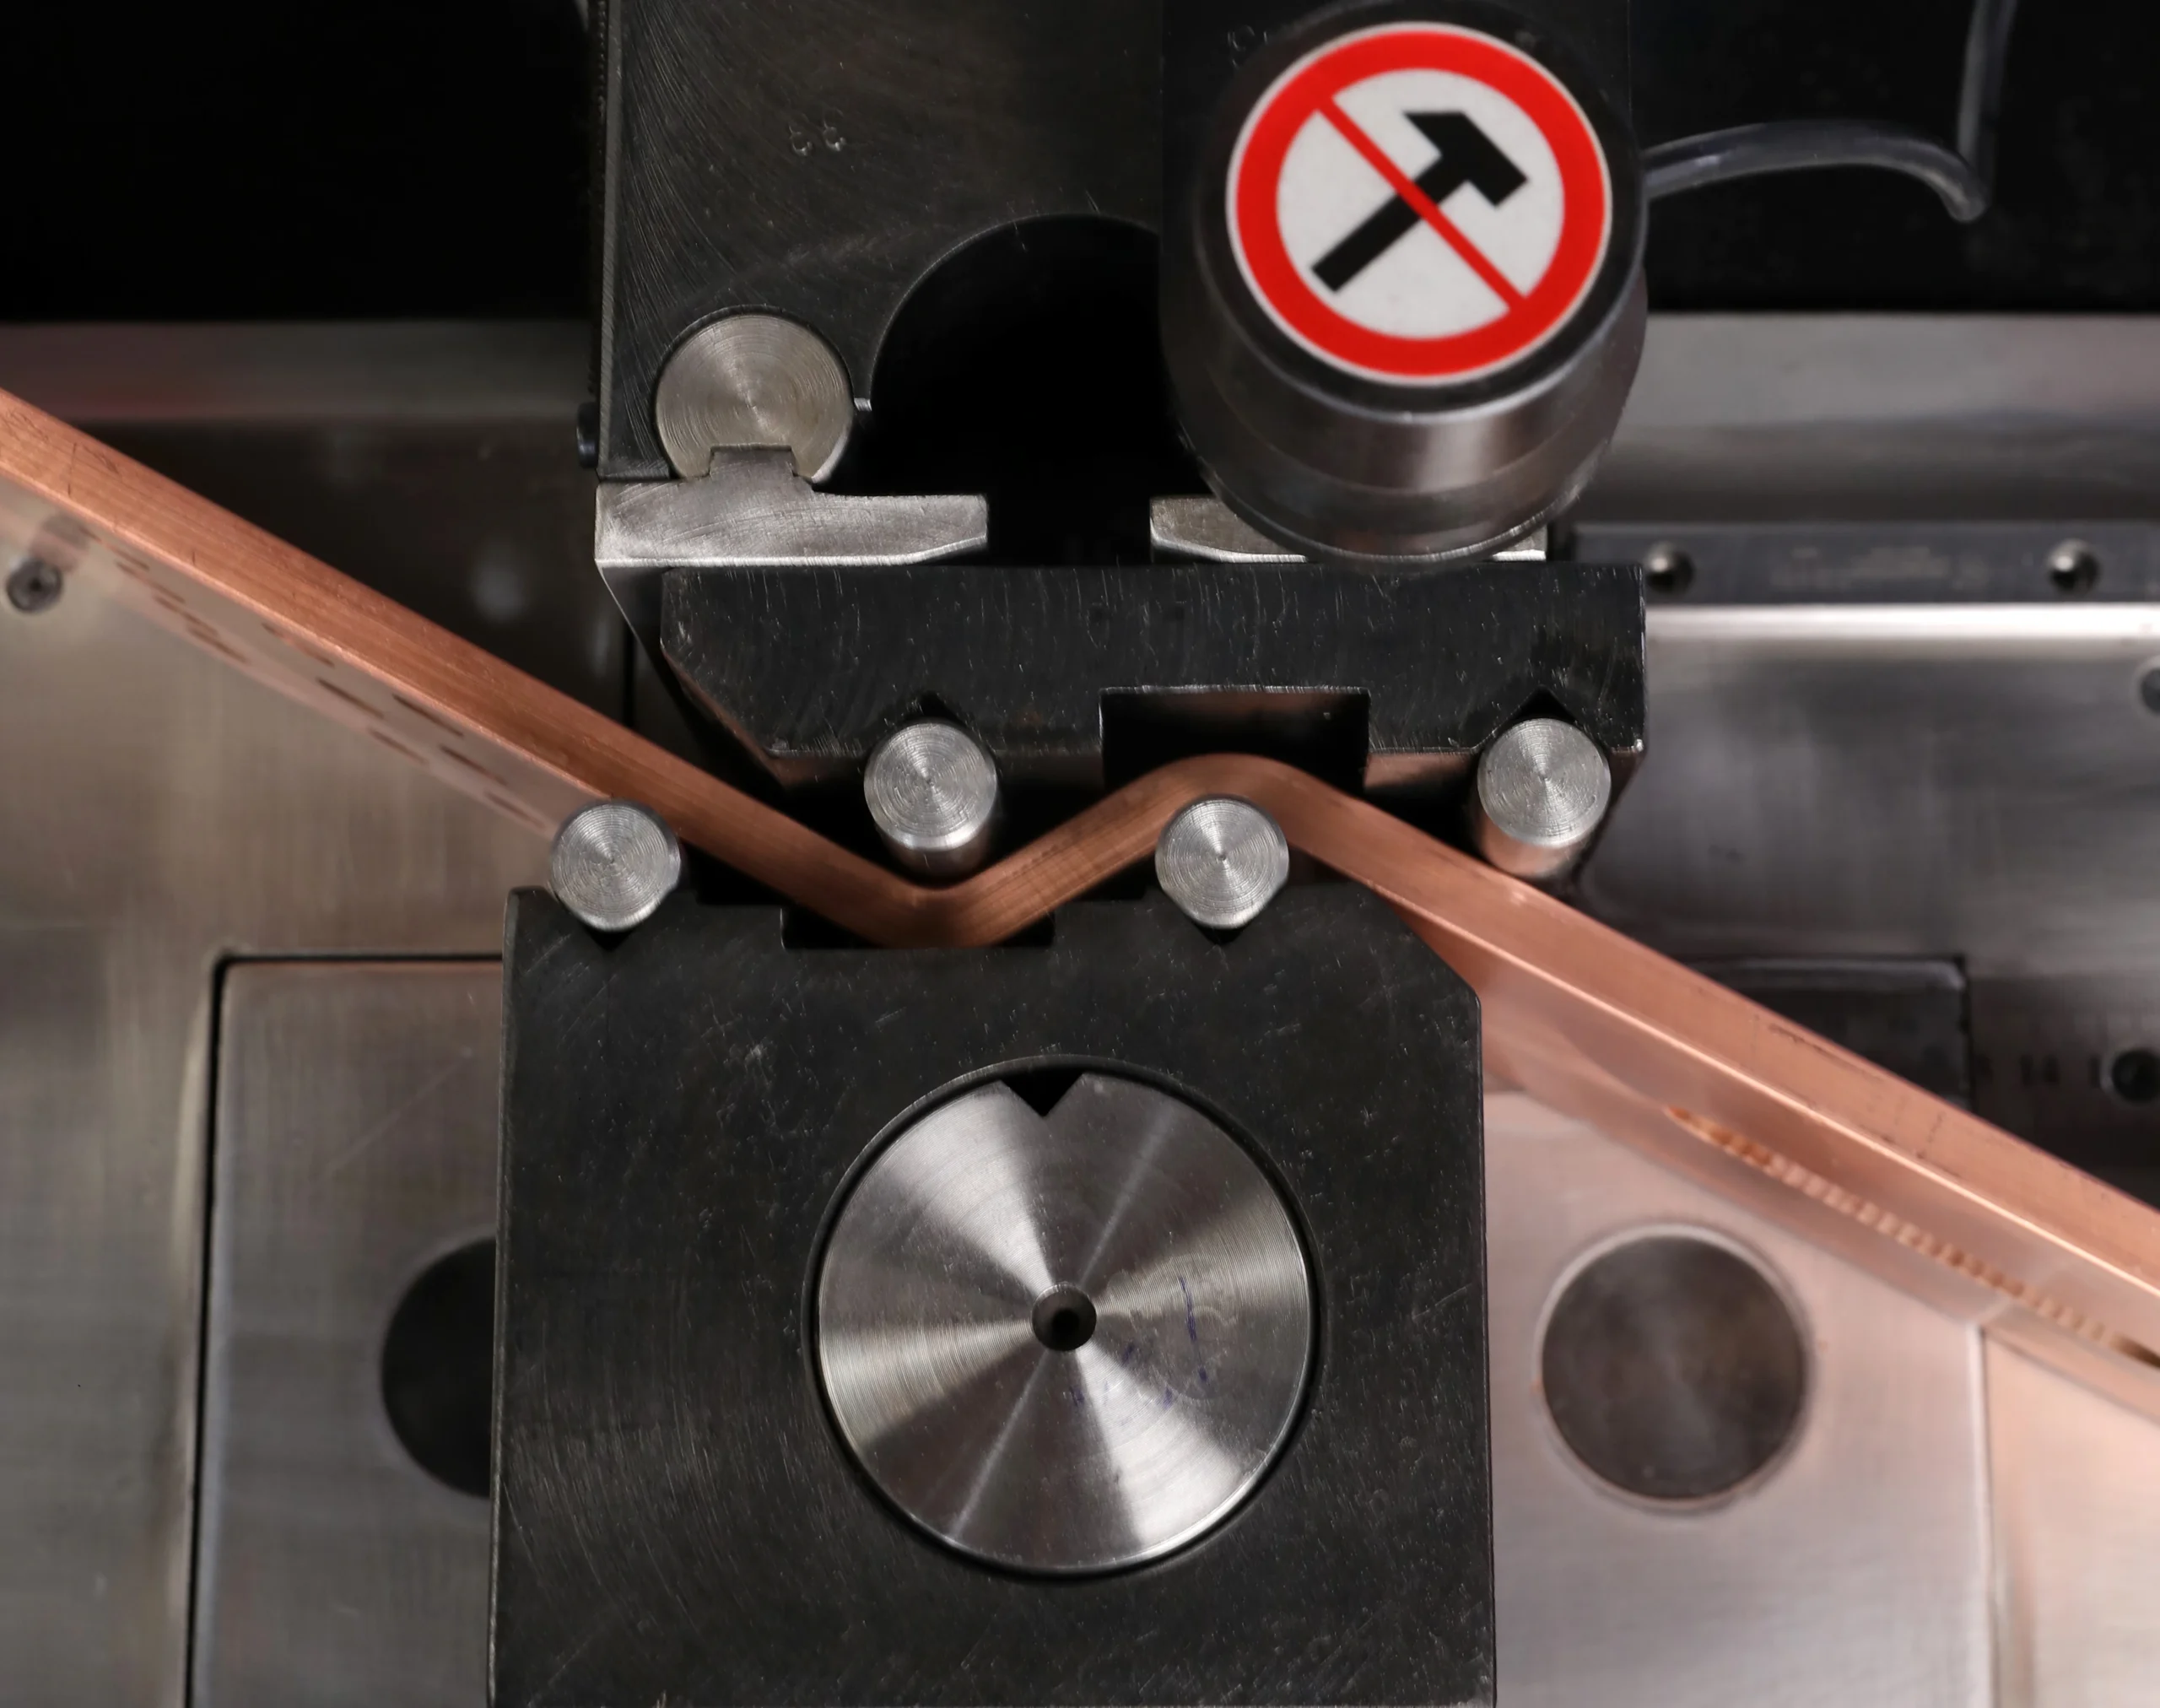
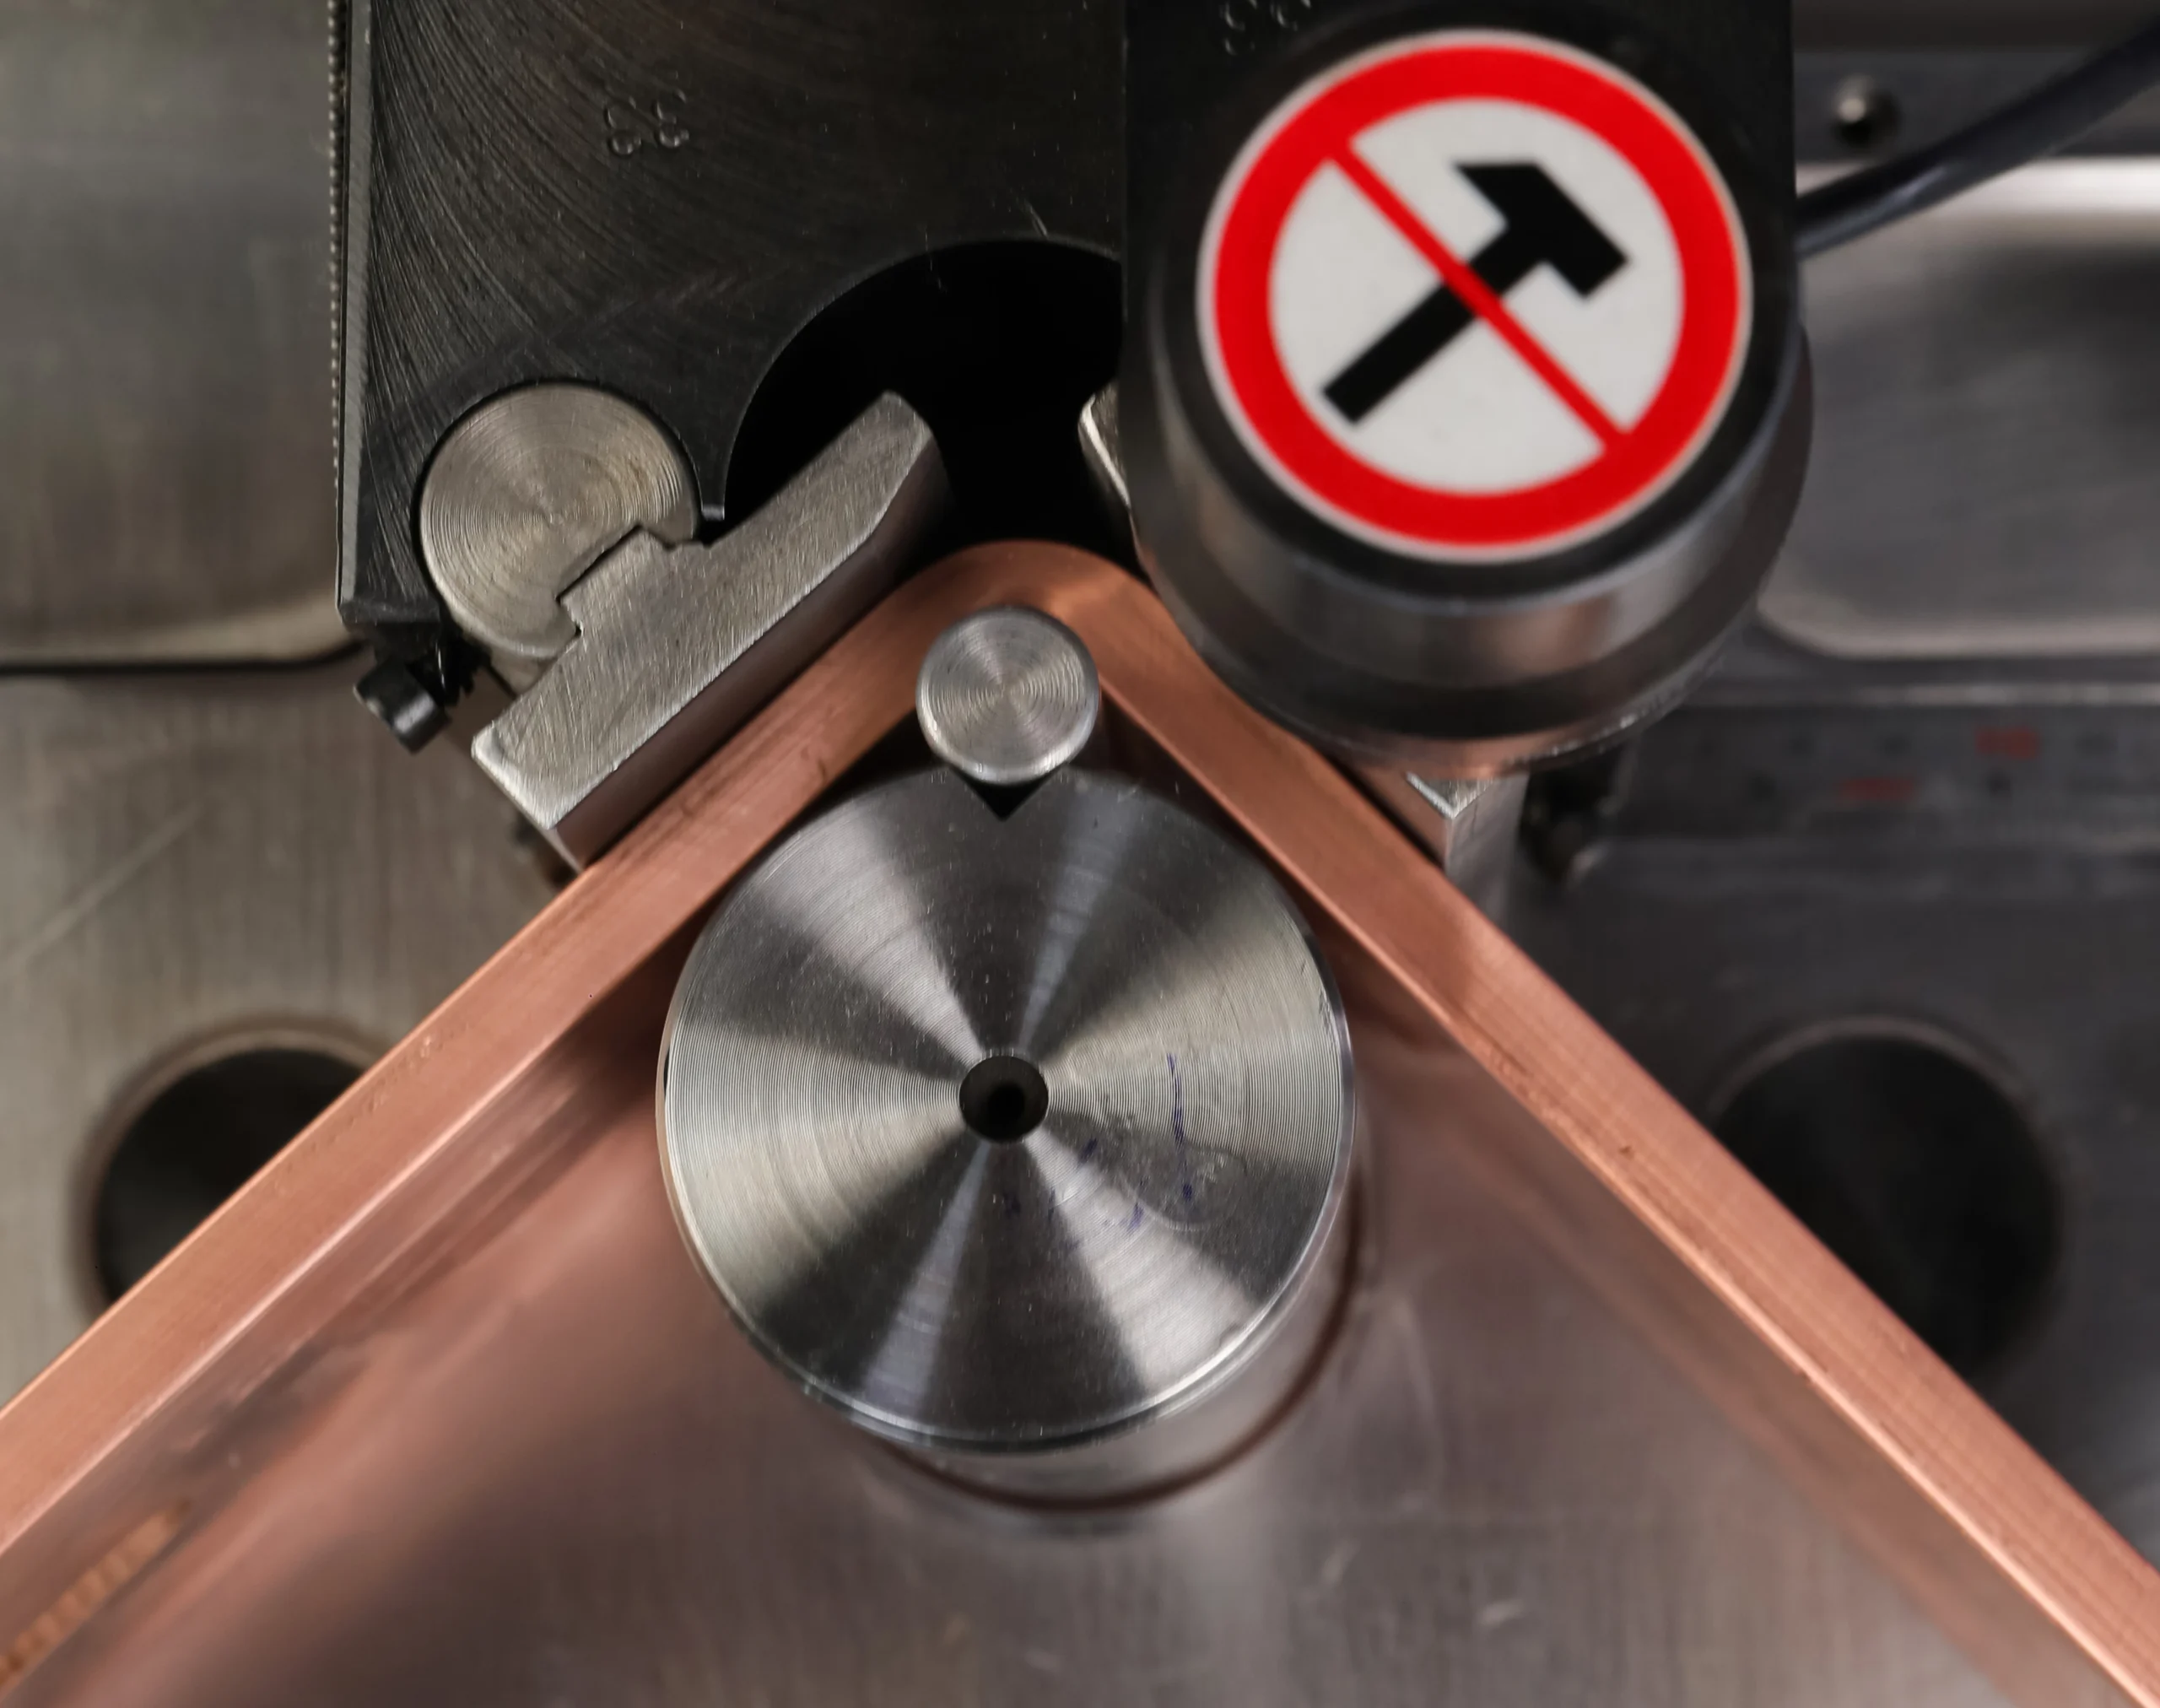
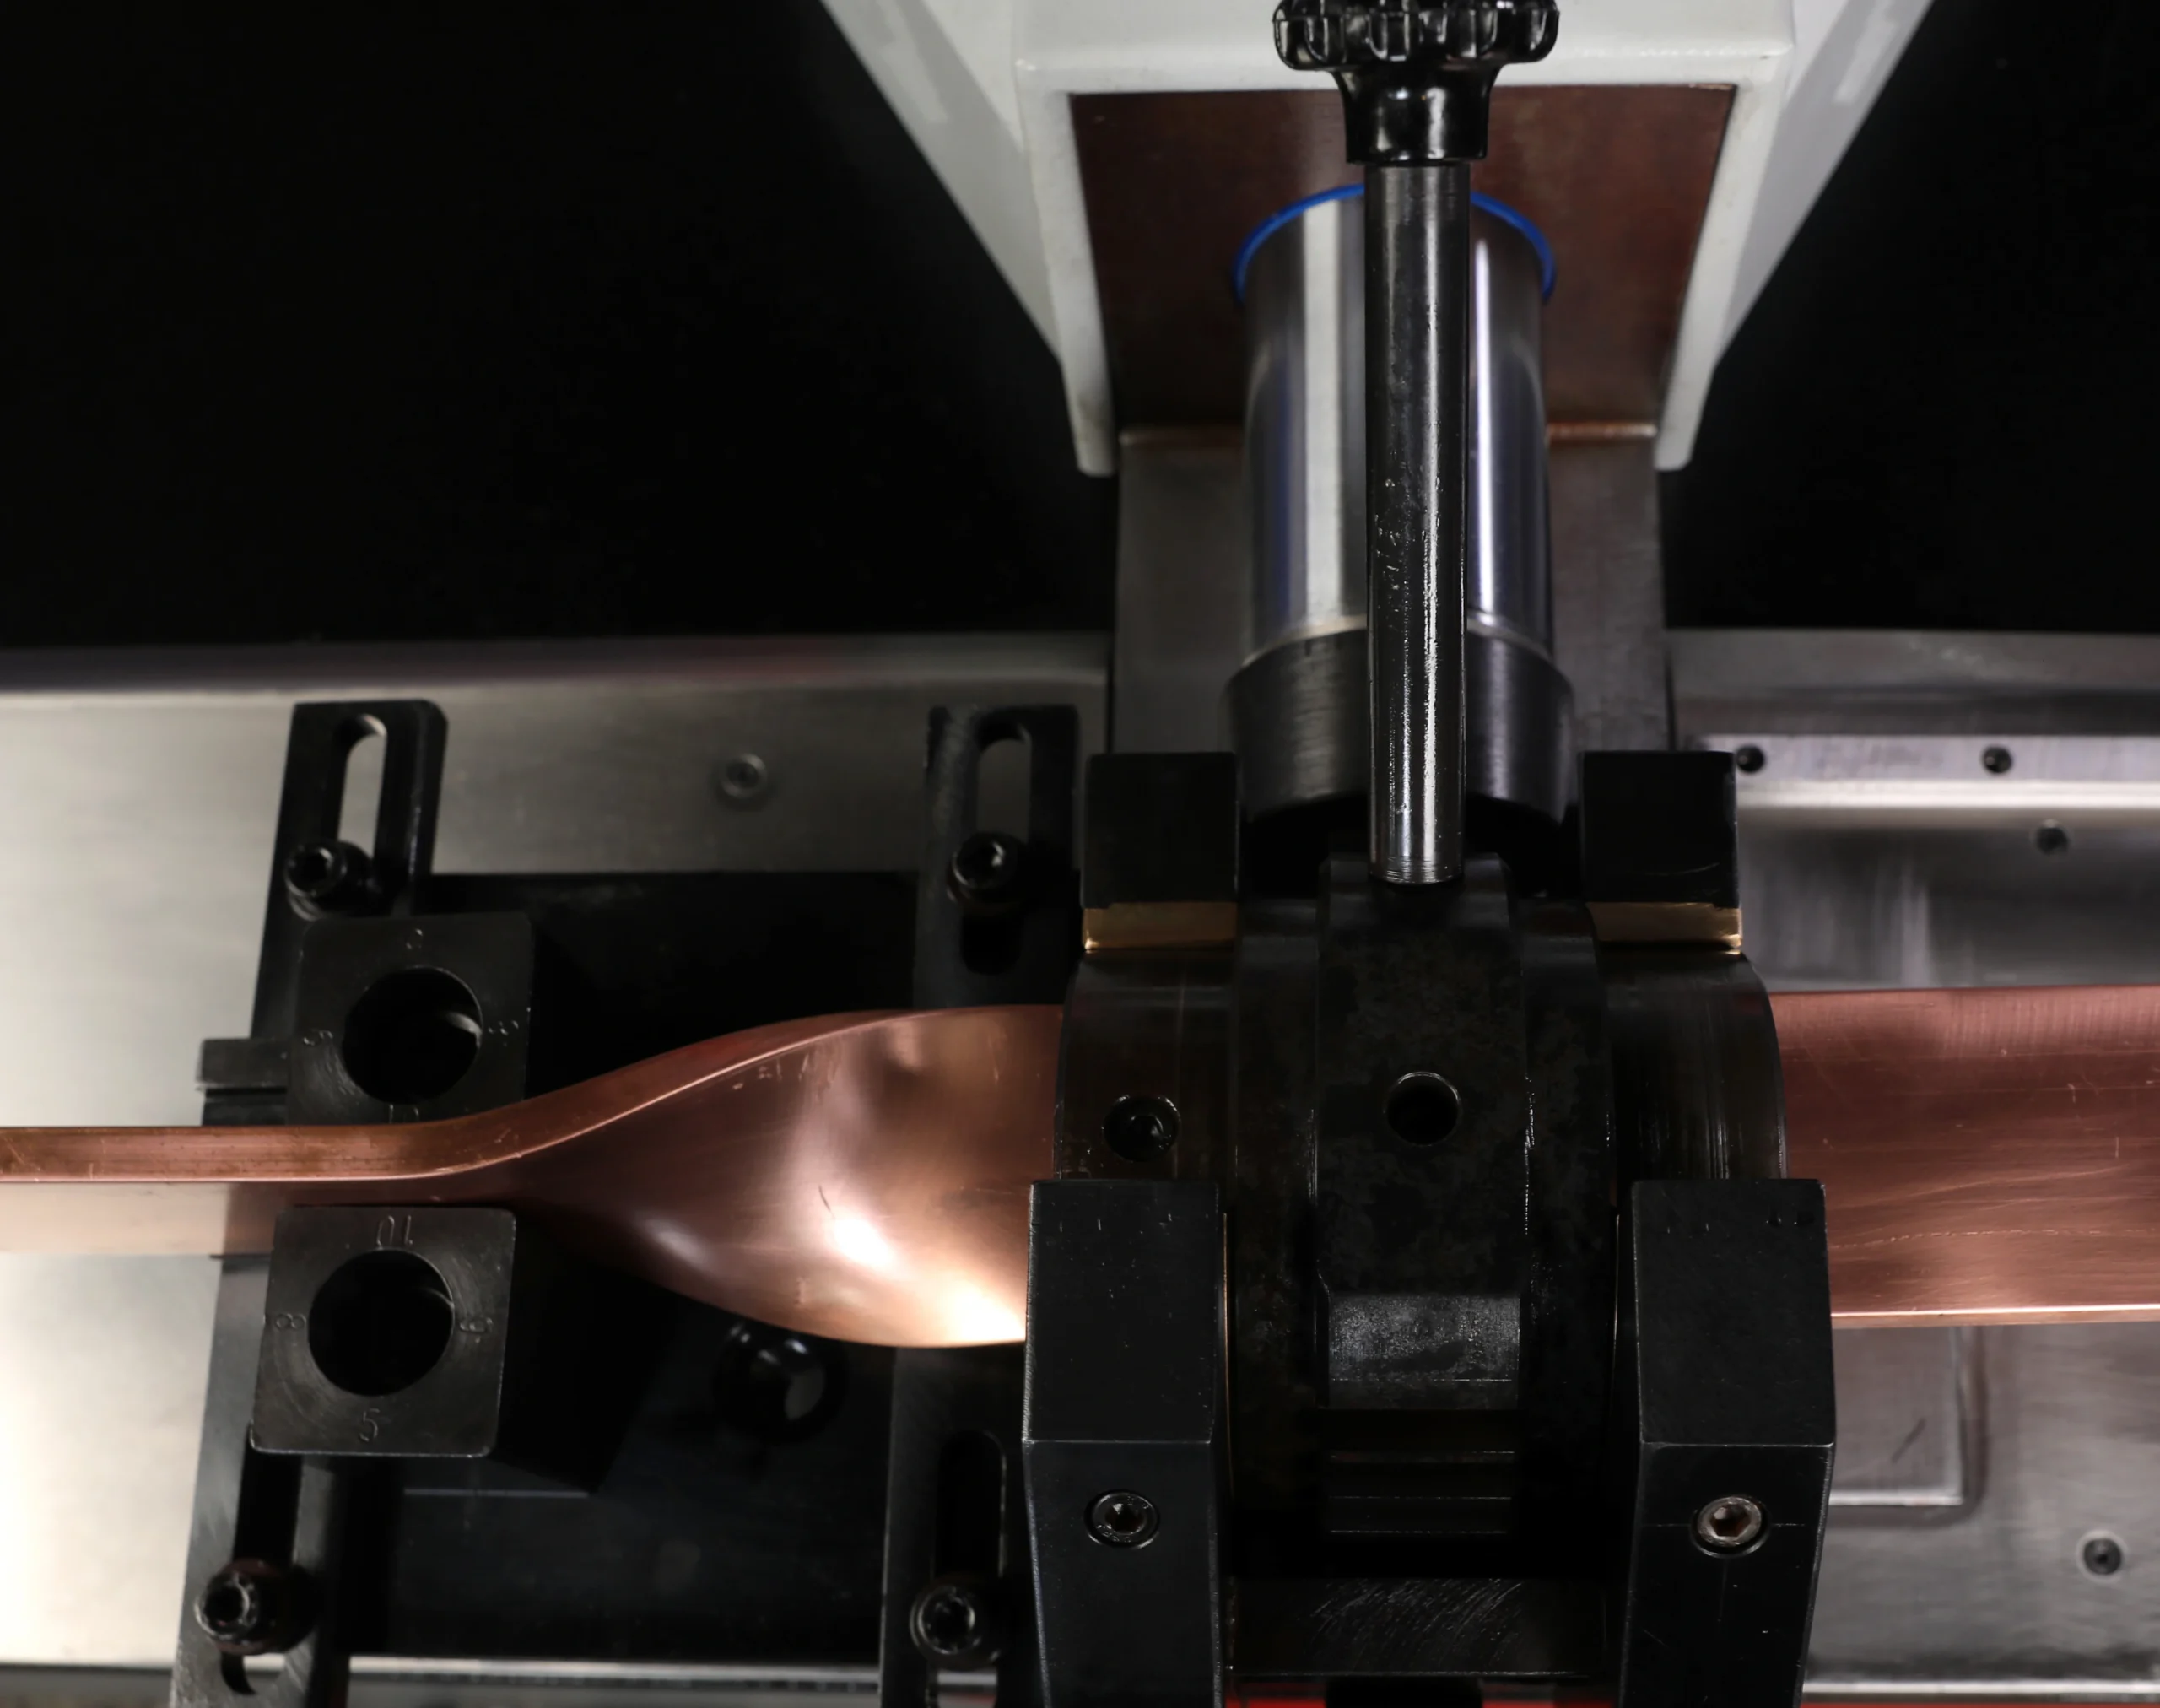
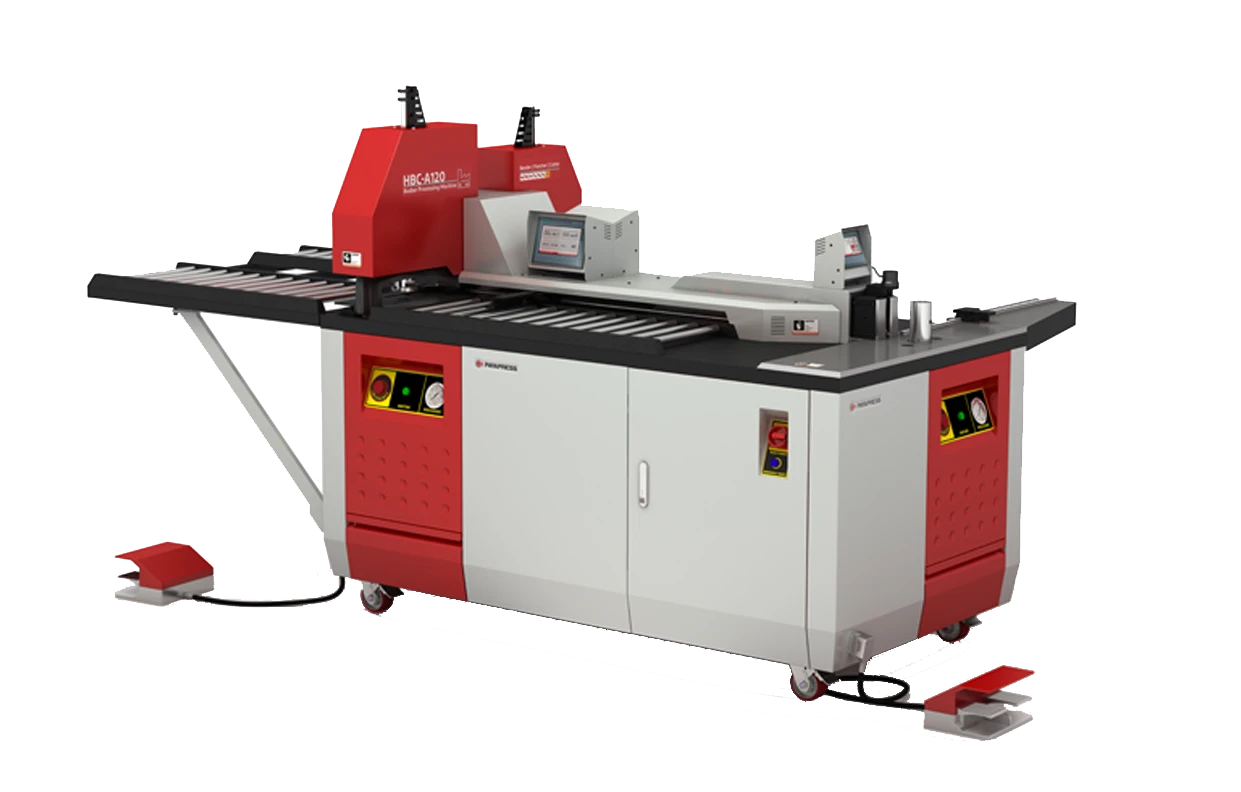
Whether working with copper or aluminum, a busbar fabrication machine ensures consistent cross-sections and clean edges that directly influence contact resistance and thermal performance.
Aluminium Busbar Size and Current Rating
Aluminium busbar current-carrying capacity is lower than copper for the same cross-section, because aluminium conductivity (≈35 MS/m) is about 61 % of copper’s. In practice, an aluminium bar needs 1.5–1.6× the cross-section of copper to carry the same current, at a target density of 0.7–1.2 A/mm². The trade-off is weight and cost: aluminium is roughly 65 % lighter and materially cheaper, which makes it the preferred conductor for long busbar runs and weight-sensitive installations. See Table 2 for the aluminium busbar size and current rating figures at both 50 K and 70 K rise.
Busbar Temperature Rise Calculation: Formula, Fundamentals & Allowable Limits
The busbar temperature rise calculation starts from a simple heat-balance principle: at steady state, the heat generated by Joule heating (P = I²R) exactly equals the heat dissipated by convection and radiation. Temperature rise (ΔT) is defined as the difference between the conductor’s steady-state operating temperature and the ambient temperature: ΔT = T_busbar − T_ambient. This value, not the absolute conductor temperature, is what IEC 61439-1 limits — because the standard must remain valid across different climatic zones. At steady state, heat generated by Joule heating (P = I²R) exactly equals heat dissipated through convective cooling and radiation.
IEC 61439-1 permits a maximum temperature rise of 70 K for uninsulated copper or aluminum conductors (busbars) when measured at a 35 °C reference ambient. For terminals connecting external conductors, the allowable thermal rise is tighter — 55 K — to protect cable insulation at connection points. IEC 60439 (the superseded predecessor standard) used comparable limits and is still referenced in legacy installations.
The simplified heat-balance relationship that links current to thermal rise is:
where I = current (A), ρ = resistivity (Ω·m), L = conductor length (m), A = cross-sectional area (m²), and k = a composite heat-transfer coefficient that captures convection and radiation. In practice, engineers use manufacturer ampacity tables — which embed these relationships — rather than solving the heat-balance equation directly from first principles for each project.
Busbar thermal performance degrades with age as oxide layers build at joints, increasing contact resistance and local hot-spot heating. Specifying tinned copper or appropriately torqued connections mitigates this in service.
Further exploration of terminal bus bar can be found in the following recommended reading.
How Ambient Temperature and Enclosure Affect Busbar Current-Carrying Capacity
Busbar ampacity is always referenced to a standard ambient temperature — 35 °C per IEC 61439-1. When the installation ambient exceeds this reference, the current-carrying capacity must be derated. For busbar thermal derating in high ambient temperature environments, a typical correction factor is approximately 0.91 at 40 °C and 0.82 at 50 °C (values from IEC-compliant manufacturer tables).
Enclosure IP rating compounds the effect: a conductor bar inside a sealed IP55 cabinet with no internal ventilation can dissipate heat only through the cabinet walls, significantly reducing its ampacity versus free-air installation. A 1000 A-rated busbar in free air may be derated to 850 A at 45 °C ambient inside a closed enclosure — a combined derating of 15 % or more. Skin effect — the tendency of high-frequency AC current to concentrate at the conductor surface — becomes significant above 400 Hz and in very large cross-sections; at 50/60 Hz power frequencies it is negligible for standard busbar profiles.
This article serves as a valuable resource for those seeking detailed information on distribution board types.
Derating Factors by Ambient Temperature (Reference: 35 °C, 70 K rise)
| Derating Factor | Ambient Temperature (°C) |
|---|---|
| 1.00 | 35 (Reference) |
| 0.91 | 40 |
| 0.82 | 45 |
| 0.71 | 50 |
| 0.58 | 55 |
Busbar Sizing Calculation: Step-by-Step Methodology
This section answers the core question of how to calculate busbar size — the same bus bar calculation applies whether you write it busbar, bus bar, or bus-bar. The busbar sizing by current and temperature rise methodology follows seven sequential steps that incorporate design current, material resistivity, target current density, thermal verification, and short-circuit withstand. Presenting the process as a numbered sequence maximizes clarity for both the design engineer and for automated extraction into a featured snippet.
- Determine design current (I): Use the maximum continuous load current, including demand factor and future growth allowance. Do not use the installed transformer rating alone unless the busbar must carry full fault contribution.
- Select conductor material: Choose copper or aluminum based on Table 1 criteria. Obtain the material’s resistivity ρ at 20 °C (copper: 1.72 μΩ·cm; aluminum: 2.82 μΩ·cm).
- Select target current density (J): For copper busbars, J = 1.0–1.6 A/mm² is typical in LV switchgear; for aluminum busbar ampacity, J = 0.7–1.2 A/mm² is standard. Higher current density means smaller cross-section but higher thermal rise.
- Calculate minimum cross-sectional area:
- Verify temperature rise: Compare the selected bar’s rated ampacity (from the manufacturer’s table or Table 2) against the IEC 61439-1 limit of 70 K at 35 °C ambient.
- Apply derating factors: Multiply the tabulated ampacity by the appropriate factors for ambient temperature, enclosure type, number of conductors per phase (mutual heating), and conductor arrangement (flat vs. edgewise).
- Confirm short-circuit withstand: Verify that the selected cross-section satisfies the I²t (ampere-squared-seconds) rating for the installation’s prospective fault current and clearing time. This is a separate but mandatory check per IEC 61439-1.
Busbar sizing for switchgear panels that must comply with type-tested or partially type-tested classifications under IEC 61439 requires that temperature rise verification be conducted by test or by comparison with a reference design — calculation alone is not always sufficient for full compliance.
IEC Affiliate Country Programme (PDF)
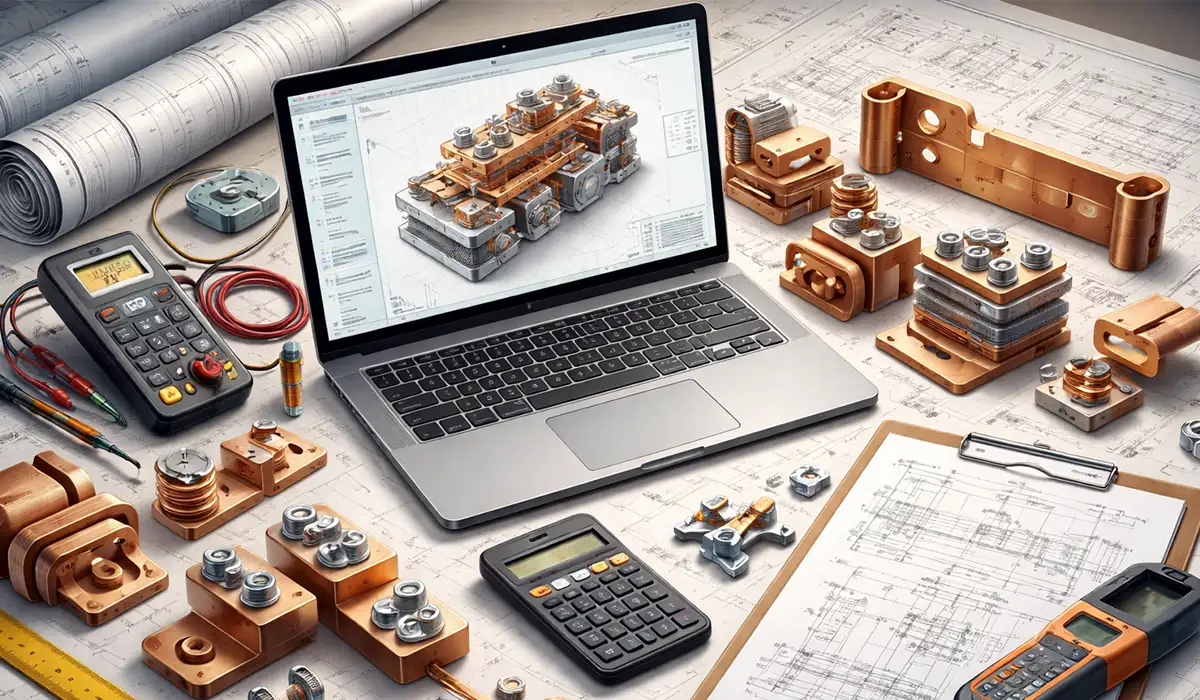
If you are looking for more information about busbar design software, it is recommended not to miss reading this article.
Busbar Sizes and Current-Carrying Capacity: Copper & Aluminium Ampacity Chart
The busbar sizing chart for copper and aluminium below gives current ratings for single flat bars mounted horizontally in free air at 35 °C ambient. To use the table: identify your design current, select either the 50 K or 70 K temperature rise column (matching your IEC 61439-1 allowance), and read off the minimum cross-section. Then apply derating factors from the previous section. Note that stacking multiple bars per phase increases current capacity but at a diminishing rate — mutual heating between adjacent bars reduces the per-bar ampacity by 10–20 % for a two-bar arrangement. Values below are indicative engineering references; always verify against the specific manufacturer’s published data.
Table 2 — Busbar Ampacity Sizing Chart by Cross-Section (Alt text: Busbar ampacity sizing chart for copper and aluminum by cross-section and temperature rise)
| Cross-Section (mm²) | Dimensions (mm) | Cu Ampacity — 50 K Rise (A) | Cu Ampacity — 70 K Rise (A) | Al Ampacity — 50 K Rise (A) | Al Ampacity — 70 K Rise (A) |
|---|---|---|---|---|---|
| 100 | 10 × 10 | 340 | 420 | 265 | 325 |
| 160 | 20 × 8 | 500 | 620 | 390 | 485 |
| 250 | 25 × 10 | 700 | 860 | 545 | 670 |
| 400 | 40 × 10 | 990 | 1 220 | 770 | 950 |
| 630 | 63 × 10 | 1 400 | 1 720 | 1 090 | 1 340 |
| 800 | 80 × 10 | 1 680 | 2 060 | 1 310 | 1 610 |
| 1 000 | 100 × 10 | 2 000 | 2 450 | 1 560 | 1 910 |
| 1 250 | 125 × 10 | 2 350 | 2 880 | 1 830 | 2 245 |
| 1 600 | 160 × 10 | 2 820 | 3 460 | 2 195 | 2 695 |
| 2 000 | 200 × 10 | 3 350 | 4 100 | 2 610 | 3 200 |
Values per IEC 61439-1 basis, single flat bar, horizontal mounting, free air, 35 °C ambient. Multiply by derating factors in Table above for other conditions.
IEC Standard for Busbar Sizing: IEC 61439-1, UL 891 & Temperature Rise Limits
The regulatory framework governing busbar current density standards is multi-layered. IEC 61439-1 (the primary reference for this guide) sets general rules for low-voltage switchgear assemblies globally, including verified temperature rise limits and the methodology for establishing rated current. It superseded IEC 60439, which used the same 70 K conductor limit but different verification procedures.
IEC 60287 covers calculation of current-carrying capacity for cables and isolated conductors, and its thermal models can be adapted to busbar design. IEEE C37.20.1 and C37.20.2 define metal-enclosed bus standards for the North American market, complementing rather than replacing IEC where projects span both regulatory zones. For switchboards in the US, UL 891 governs; NEMA PB 2 covers deadfront distribution switchboards — both specify temperature rise limits consistent with IEC values for conductor bars.
The IEC vs. UL distinction matters practically: IEC 61439-1 permits verification by calculation, test, or comparison, giving designers flexibility. UL 891 type-testing is more prescriptive for North American listed equipment. Engineers working on projects requiring both CE and UL marks must satisfy the stricter of the two requirements for each parameter. Regional standards such as BS EN 61439 (UK), DIN EN 61439 (Germany), and AS/NZS 61439 (Australia/New Zealand) are all national adoptions of IEC 61439-1 with negligible technical deviations.
Current density limits are not mandated as fixed values in IEC 61439-1 — the standard governs the outcome (temperature rise) rather than the input parameter. The 1.0–1.6 A/mm² copper and 0.7–1.2 A/mm² aluminum ranges cited in this guide are established engineering practice derived from copper.org and manufacturer design guides.
For a comprehensive understanding of ground bus bar, we highly recommend reviewing this article.
Practical Busbar Sizing Example: 2000 A LV Distribution Board
This worked example applies the 7-step busbar sizing methodology to a real-world scenario: a copper main busbar for a 2000 A LV distribution board installed in a ventilated enclosure at a site ambient of 40 °C. The example addresses the long-tail question “how to calculate busbar cross section for 3000 amps” in principle (scaling applies) while keeping figures tractable. Busbar sizing for 630A LV distribution boards follows the same steps with proportionally smaller cross-sections.
Given Data and Design Parameters
- Design current: I = 2 000 A
- Material: copper (ρ = 1.72 μΩ·cm)
- Ambient temperature: 40 °C (site), 35 °C reference per IEC 61439-1
- Enclosure: ventilated (IP31), derating factor for 40 °C = 0.91
- Temperature rise limit: ΔT_max = 70 K (IEC 61439-1)
Step-by-Step Calculation
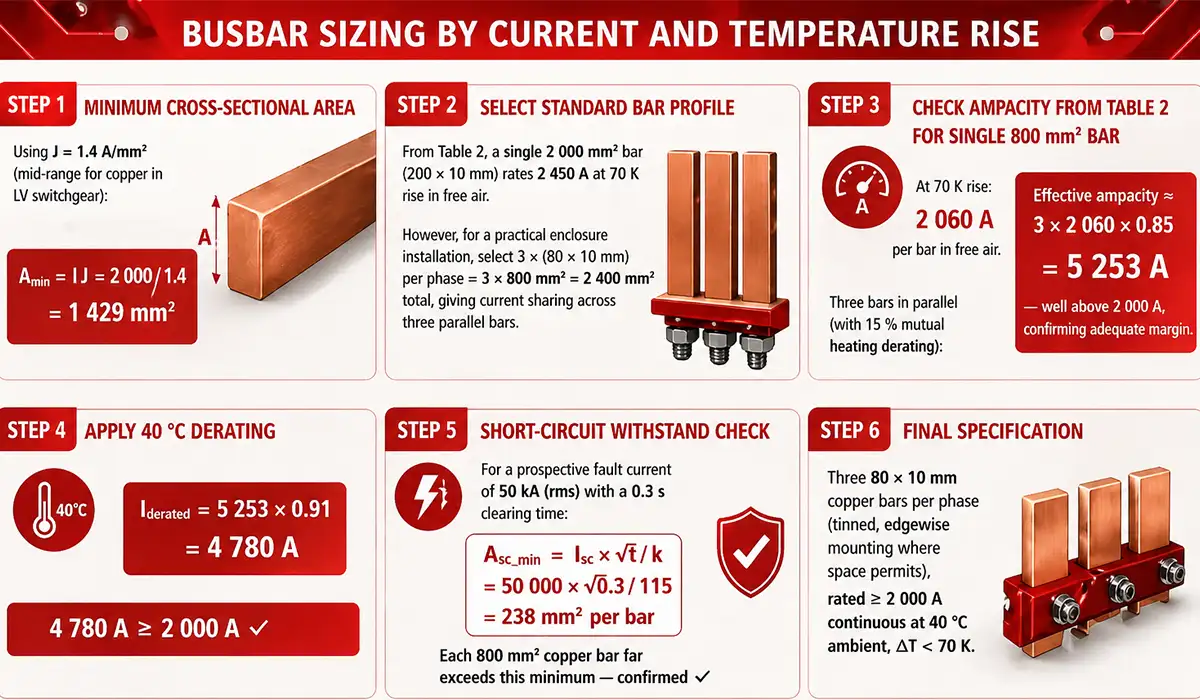
Step 1 — Minimum cross-sectional area:
Using J = 1.4 A/mm² (mid-range for copper in LV switchgear):
Step 2 — Select standard bar profile:
From Table 2, a single 2 000 mm² bar (200 × 10 mm) rates 2 450 A at 70 K rise in free air. However, for a practical enclosure installation, select 3 × (80 × 10 mm) per phase = 3 × 800 mm² = 2 400 mm² total, giving current sharing across three parallel bars.
Step 3 — Check ampacity from Table 2 for single 800 mm² bar:
At 70 K rise: 2 060 A per bar in free air. Three bars in parallel (with 15 % mutual heating derating): effective ampacity ≈ 3 × 2 060 × 0.85 = 5 253 A — well above 2 000 A, confirming adequate margin.
Step 4 — Apply 40 °C derating:
Step 5 — Short-circuit withstand check:
For a prospective fault current of 50 kA (rms) with a 0.3 s clearing time:
Each 800 mm² copper bar far exceeds this minimum — confirmed ✓.
Step 6 — Final specification:
Three 80 × 10 mm copper bars per phase (tinned, edgewise mounting where space permits), rated ≥ 2 000 A continuous at 40 °C ambient, ΔT < 70 K. This busbar sizing by current and temperature rise process satisfies IEC 61439-1 thermal requirements.
This article serves as a valuable resource for those seeking detailed information on Victron busbar.
Conclusion: Ensuring Safe and Efficient Busbar Design
Correct busbar sizing by current and temperature rise integrates three inseparable engineering disciplines: conductor dimensioning, thermal analysis, and standards compliance. The three headline takeaways from this guide are: (1) cross-sectional area must reflect both design current and a realistic target current density for the chosen material; (2) temperature rise must be verified against IEC 61439-1 limits and corrected for actual site ambient and enclosure conditions; and (3) material choice — copper vs. aluminium — fundamentally changes the conductor profile, weight, and total cost of the installation.
Engineers who embed these steps into their design workflow — and verify against Table 2 ampacity data before issuing drawings — significantly reduce the risk of thermal failures in service. For your next project, use our Busbar Sizing Calculator or download the Busbar Ampacity Sizing Chart PDF for desk reference. Our engineering team is also available for a technical consultation on complex or non-standard installations.
Further exploration of busbar future trends can be found in the following recommended reading.