




If you’d rather listen than read, feel free to play the audio file below for the rest of this article.
Why Generic CNC ROI Numbers Do Not Transfer
Most CNC ROI examples online were written for a different machine and a different business model. Two structural differences stop them from carrying over to a CNC busbar machine ROI case.
The first is scale. Published examples model machining centers and laser cutters that cost far more than a busbar processor. That gap changes the whole argument: the approval threshold, the payback period finance expects, and how much analysis the decision justifies.
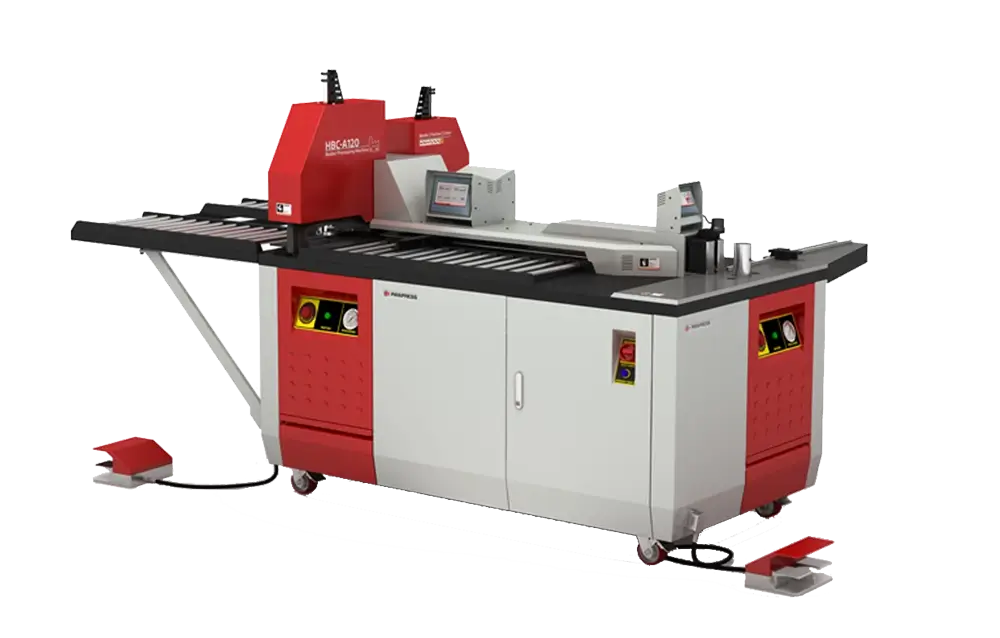
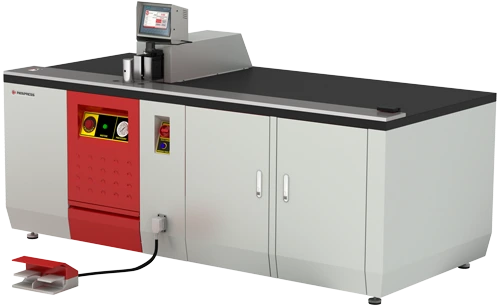
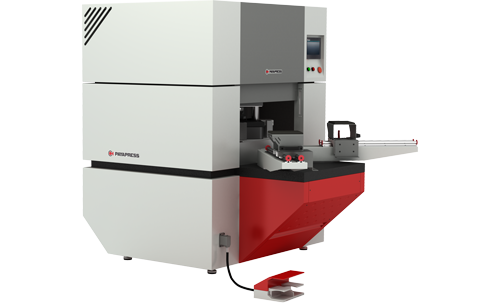
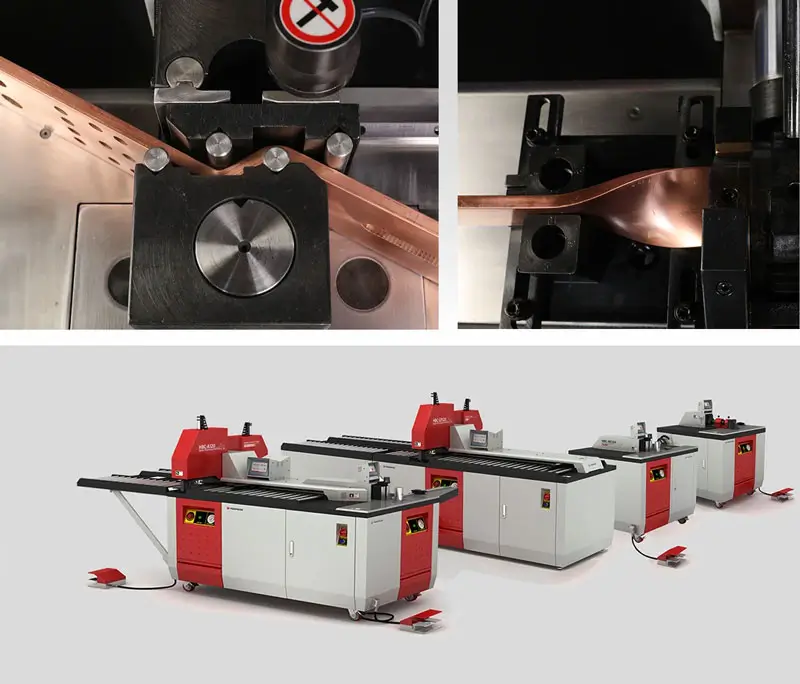
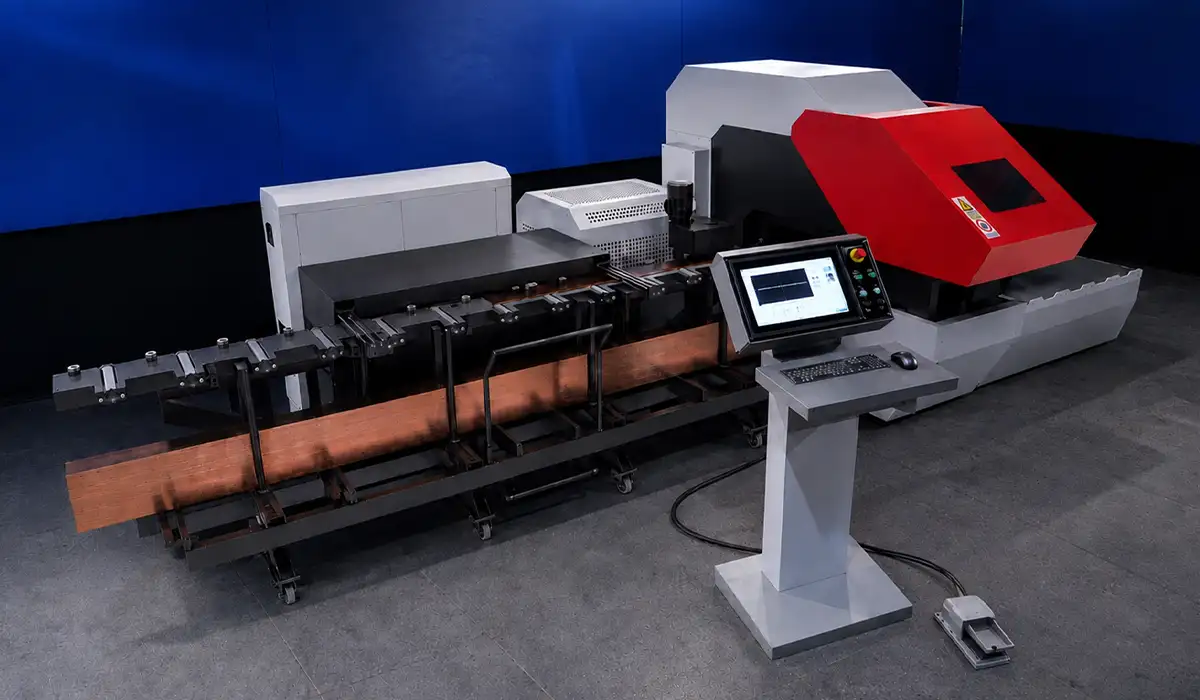
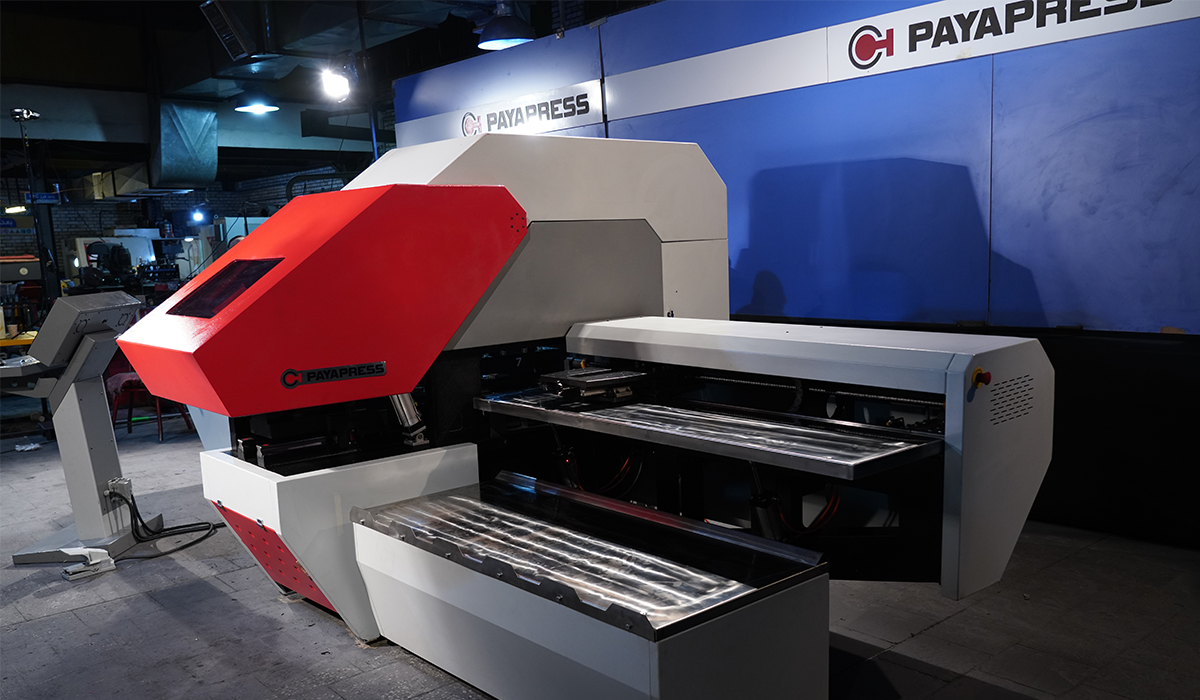
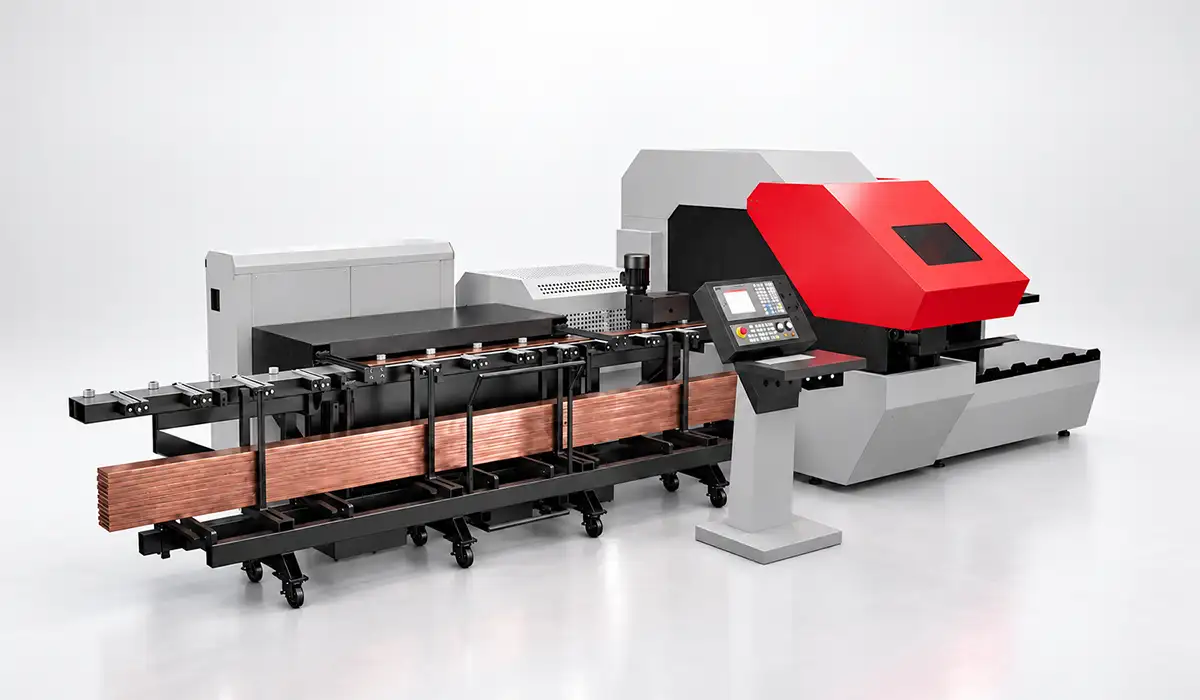
Before reading on, we recommend visiting the PAYAPRESS CNC busbar machine page to get to know the machine and its features in more detail.
The second is the revenue model. Most CNC ROI frameworks assume the machine earns billable hours from new customers. A busbar processor in a switchgear or panel-building plant usually does something different. It cuts the labor and waste on work the company already has. The return is cost avoided, not revenue gained, and finance judges those two very differently.
So present your case as capacity expansion only if it genuinely is one. Finance teams spot a borrowed template quickly, and once they do, they discount every number in it.
The Model
A CNC busbar machine ROI case needs one formula, used consistently from the first page to the last:
Payback (months) = total investment ÷ monthly net benefit
Define total investment in full, because an understated investment is the fastest way a case collapses under review. Include the machine, tooling package, installation, electrical preparation, any facility changes, training, and delivery or import costs.
Monthly net benefit = labor saved + scrap saved + rework avoided + throughput value − incremental operating cost
The investment side comes from a quotation. The benefit side has to be built from your own shop data, and that is what the rest of this guide covers. For simple annual ROI, use the same inputs: monthly net benefit × 12, divided by total investment.
Build every case in three versions: conservative, expected and optimistic. Lead with the conservative one. If your busbar machine payback period only works in the optimistic version, you do not yet have a case.
[IMAGE 1: Payback model diagram — investment and benefit variables feeding the calculation, no currency symbols. Alt text in delivery note.]
For deeper background on the standards side of this topic, see the IEC reference publication.
Where the Savings Actually Come From
Monthly net benefit comes from four levers: labor, material, setup and capacity. Each one reduces your busbar fabrication cost per part in a different way. Most shops get the balance wrong: they overestimate the labor saving and underestimate the material saving.
[IMAGE 2: Savings-source breakdown — labor, material, setup, capacity, no currency symbols. Alt text in delivery note.]
Labor
Measure labor savings; do not assume them. Time how long a finished bar takes today from start to finish. Include marking, measuring, repositioning, checking and carrying bars between stations, not only the seconds the tool is in contact with copper. That full time is your real baseline.
Then frame the saving honestly. Automation moves labor rather than eliminating it, because someone still programs the machine, sets it up and inspects the parts. A business case that removes a headcount nobody intends to remove will not survive its first review. The defensible version counts hours redeployed to work the shop cannot take on today, or overtime avoided during peak periods.
Model it as labor saved = H × R, where H is hours removed per month and R is your fully loaded hourly rate. One figure often quoted in this market is 20 to 30 labor hours saved per month. Use it to test your model, not as a result to expect.
Note: This range is for general information only. Actual labor savings depend on your parts, volumes and workflow, and may differ for your company.
To build a realistic fully loaded rate, with benefits and payroll costs on top of wages, see employer compensation cost data from the U.S. Bureau of Labor Statistics.
Material and scrap
Material is where most ROI models go wrong. Programmed cutting and nesting raise material utilization, and nesting software vendors report rates above 98% on standard stock. Copper arrives in fixed stock lengths, commonly 6 m, so the gain comes from how parts are arranged along each length.
Note: These figures are indicative only. Utilization and stock lengths vary by supplier, part mix and software, so your results may differ.
Here is the correction most models miss: offcut is not worthless. Copper scrap has real resale value, so the saving is the spread between new copper and scrap, not the full purchase price. Model it as scrap saved = W × (Pn − Ps), where W is offcut weight avoided per month, Pn the new-copper price and Ps the scrap price. Using the full price inflates the saving, and a reviewer who spots it will distrust the rest of the document.
Scrapped finished parts are the second material saving. A mis-punched bar costs you its copper spread plus every minute of labor already spent on it.
Copper prices move constantly, which makes this the most sensitive line in the model. Update it with current prices before every review.
Scrap value also depends on grade. ReMA’s scrap specifications define the grades buyers use to price copper scrap.
Setup and changeover
Setup is the lever most models leave out entirely. With stored programs, every repeat order for a part starts from a saved program, not from a drawing and a tape measure.
That leads to a counterintuitive result. Shops with high part variety and small batches gain more than shops with long runs. Setup cost is paid on every changeover, so the more changeovers you make, the more often the saving recurs.
Measure it directly instead of guessing a percentage. Count repeat-part changeovers per month and time a representative one today. Then model setup saved = N × (T1 − T2) × R and add it to the labor line. N is repeat-part changeovers per month, T1 today’s changeover time, and T2 the time to recall a program and check tooling.
Keep the limit in view. The first run of any new part still needs programming and a first-article check, so this saving applies to repeat parts only.
Throughput and capacity
Capacity belongs in the model only if work is waiting for it, or if busbar preparation genuinely limits how many panels you ship.
If your shop is not capacity-limited, freed hours are a soft benefit. Present them that way rather than converting them into money, because finance challenges this line first.
If busbar work does hold up panel deliveries, measure the gain in panels shipped, not bars per hour. Throughput value is then extra panels shipped per month × contribution margin per panel.
Quality adds a smaller throughput effect: fewer bars rejected at assembly means fewer interruptions to the downstream schedule.
The Costs People Leave Out
Name these costs yourself. A case that lists its own costs earns more trust than one that waits to be asked about them. Together, they give finance the total cost of ownership view it will ask for anyway.
Consumable tooling. Punches, dies and blades wear and are replaced on condition. Budget them as a recurring line, not as part of the purchase.
Maintenance. Plan hydraulic fluid changes at 2,000 to 4,000 operating hours or annually, whichever comes first, plus lubrication and periodic calibration or OEM service.
Note: This interval is a general guide. Always follow your machine’s manual; actual intervals depend on usage and operating conditions.
Software and control. Include any license, update or support contract, plus an offline programming station if you plan to use one.
Training and the learning curve. Output in the first weeks is not steady-state output. A model that assumes full output from day one misses its own forecast in the first month.
Installation and facility. Count electrical supply, floor space for infeed and outfeed, and storage for stock and dies.
Energy. Machines in this class run motors on the order of 11 kW. Estimate energy use from measured load and running hours. It is a real line, but small next to labor and material.
Note: Motor power varies by model and configuration. This figure is for information only; check the specification of the machine you are evaluating.
Financing. If the purchase is financed, include the financing cost, because finance will then compare the monthly saving against a monthly payment.
Building the Case for Approval
Analysis alone does not get a machine approved; a clear procedure does. These five steps turn your numbers into a CNC busbar machine ROI case finance can sign off.
Step 1: Baseline before you buy. Spend two weeks recording time per bar, changeovers per month, scrap weight and parts rejected at assembly. Remembered numbers are almost always optimistic, and reviewers can tell.
Note: Two weeks is a suggested starting point. A longer period may suit your company if demand is seasonal or irregular.
Step 2: Price the baseline. Use your own labor rate, copper purchase price and scrap price, not industry averages.
Step 3: Build three scenarios. Write each assumption next to its figure, not in a footnote, so reviewers challenge the assumption instead of the result.
| Model input | Conservative | Expected | Optimistic |
|---|---|---|---|
| Labor hours removed | Low end of baseline | Baseline average | High end of baseline |
| Copper spread | Narrowest recent | Current | Widest recent |
| Utilization | Below plan | At plan | Above plan |
| Learning curve | Slower than planned | As planned | Faster than planned |
Step 4: Name the risks yourself. Raise below-plan utilization, copper price movement and the learning curve before a reviewer does. Risks you raise first read as rigor; risks a reviewer finds read as omissions.
Step 5: Add unpriced benefits honestly. List the benefits you cannot price: consistent parts at assembly, less dependence on one skilled operator, and drawings you currently turn away. Show them, but keep them out of the payback figure.
Finally, frame the comparison correctly when you justify a CNC purchase. The alternative to the machine is not zero cost; it is paying today’s labor, scrap and rework costs indefinitely.
What Breaks the Model
Five factors break a payback model, and each has a clear mechanism. Run a sensitivity analysis on all five before a reviewer does it for you.
- Utilization below forecast. Net benefit scales almost linearly with utilization, so payback stretches as volume falls: at half the planned volume, payback at least doubles. This is usually the largest single risk.
- Copper price movement. It moves the material saving in both directions, which is why the model uses the new-versus-scrap spread rather than the full copper price.
- Job mix change. A case built on variety weakens if work shifts to long runs; one built on volume weakens if work shifts to one-offs.
- Operator turnover during the learning curve. Losing a trained operator early resets part of the benefit and delays payback.
- Understated investment. Tooling, training and installation left out at the start push real payback well beyond the modeled figure.
Then show the break-even utilization: the level at which payback exactly meets your company’s threshold. It tells finance how much safety margin the case has. Twelve months after commissioning, rerun the model against actual results; that record makes the next machine request faster to approve.
Conclusion about CNC Busbar Machine ROI
The strongest CNC busbar machine ROI case is the most conservative one that still works. Shops that win approval measure their baseline before they ask: real time per bar, real changeover counts, real scrap weight, and their own labor and copper prices instead of published averages or a borrowed template.
A credible case also names its own weak points. It counts the full investment, lists the recurring costs of tooling, maintenance and training, and shows how payback changes when utilization drops or copper prices move. Leading with the conservative scenario and showing break-even utilization tells finance the numbers have been tested, not just defended.
Approval is not the end of the work. Rerunning the model twelve months after commissioning confirms the return and builds a track record for the next machine request. If you sell to panel builders facing this decision, become a PAYAPRESS representative and help them build that case.


Rate this article
Choose a rating from 1 to 5 stars.
No ratings yet