




If you’d rather listen than read, feel free to play the audio file below for the rest of this article.
What Is a Single-Line Diagram?
What is a single line diagram? It is a simplified drawing of a three-phase power system that uses one line to stand for all three phases of each circuit. It runs from the source to the loads and shows every major device with its ratings and protection.
Single-line and one-line mean the same thing, so a one line diagram and an electrical single line diagram name the same document. Engineers use it to plan capacity, set protection and run fault studies.
On site, electricians use it to find which breaker feeds a panel before a lockout. In short, the one line diagram electrical teams keep on file is their master record.
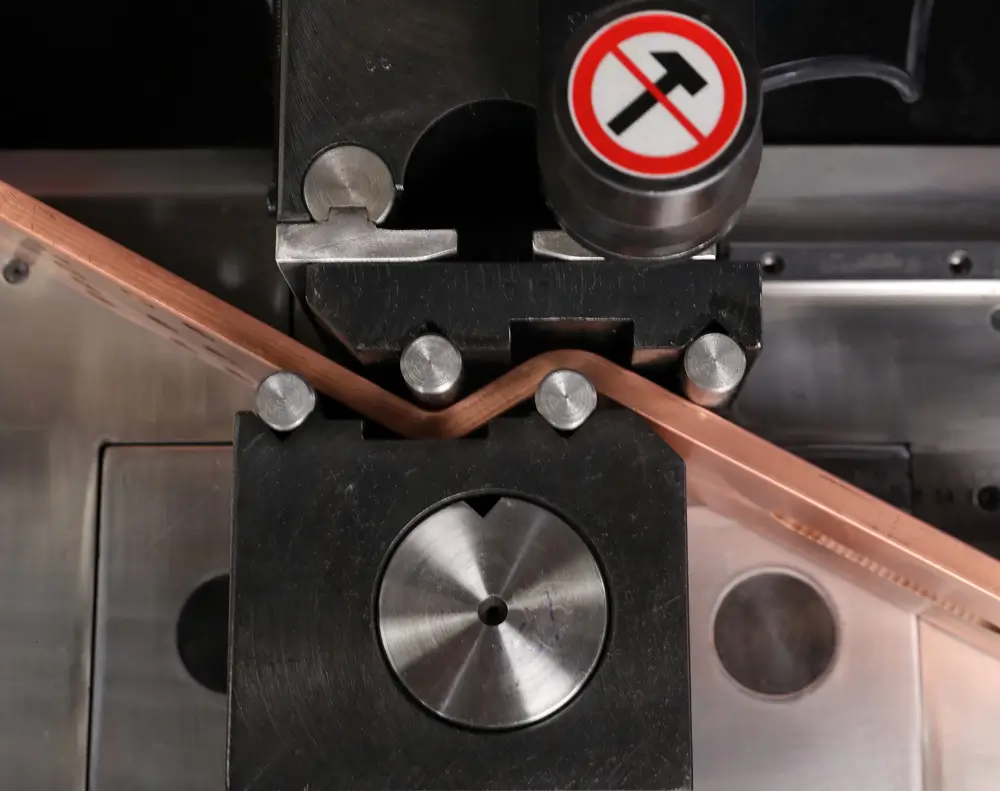
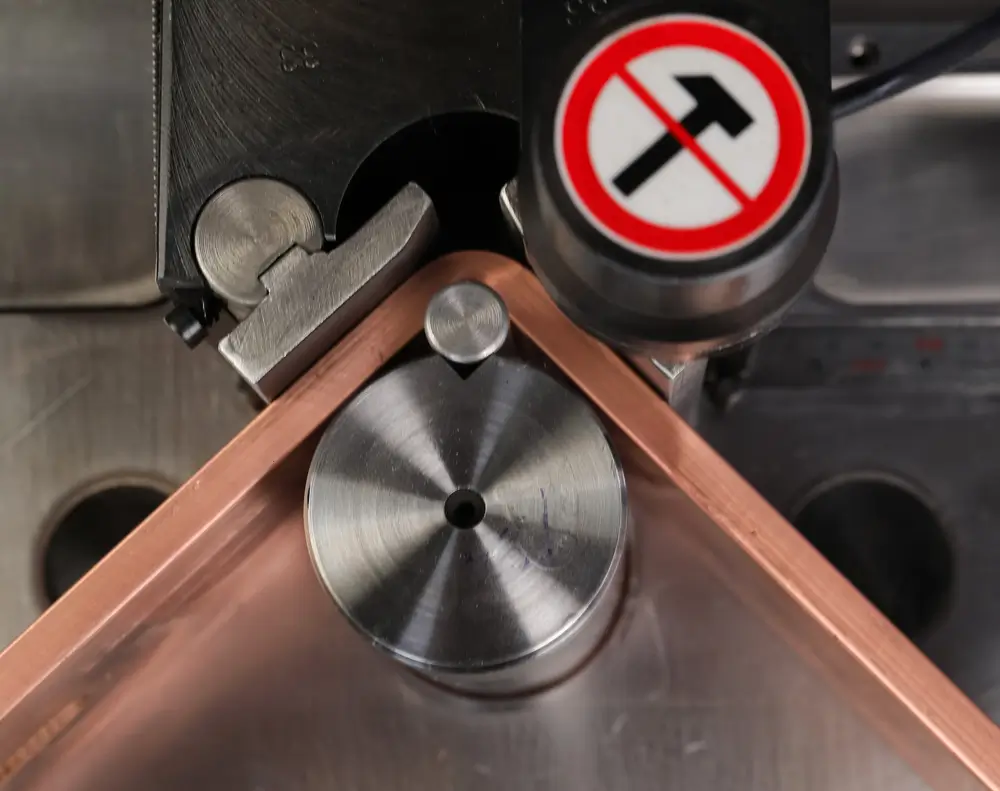
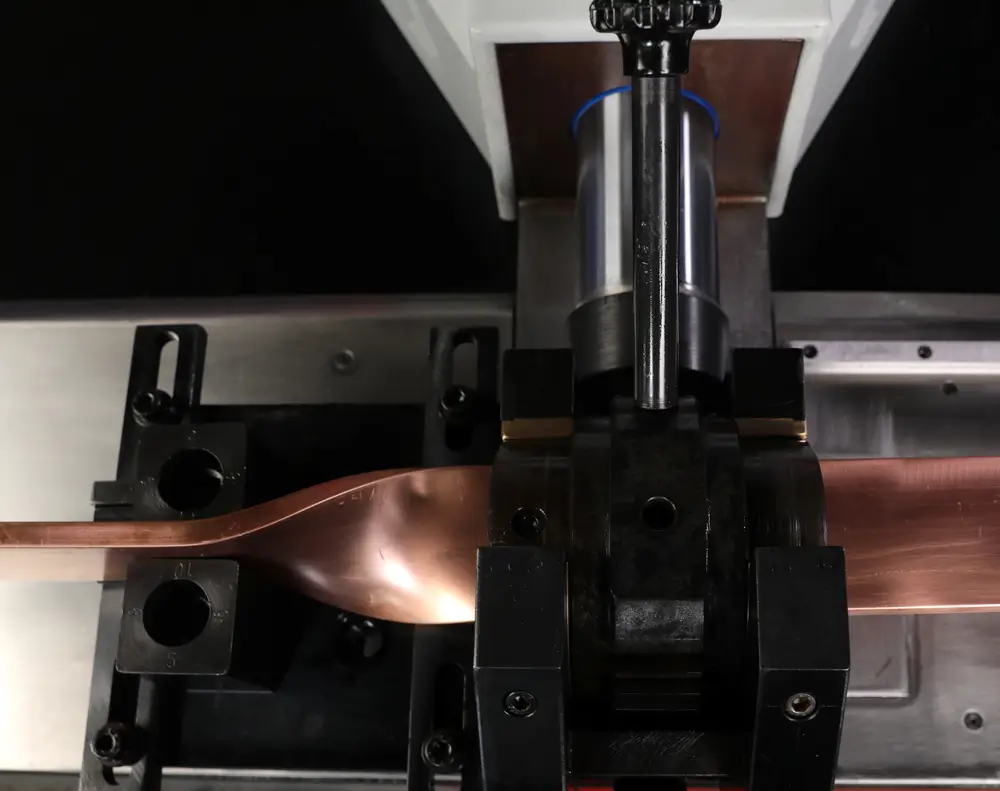
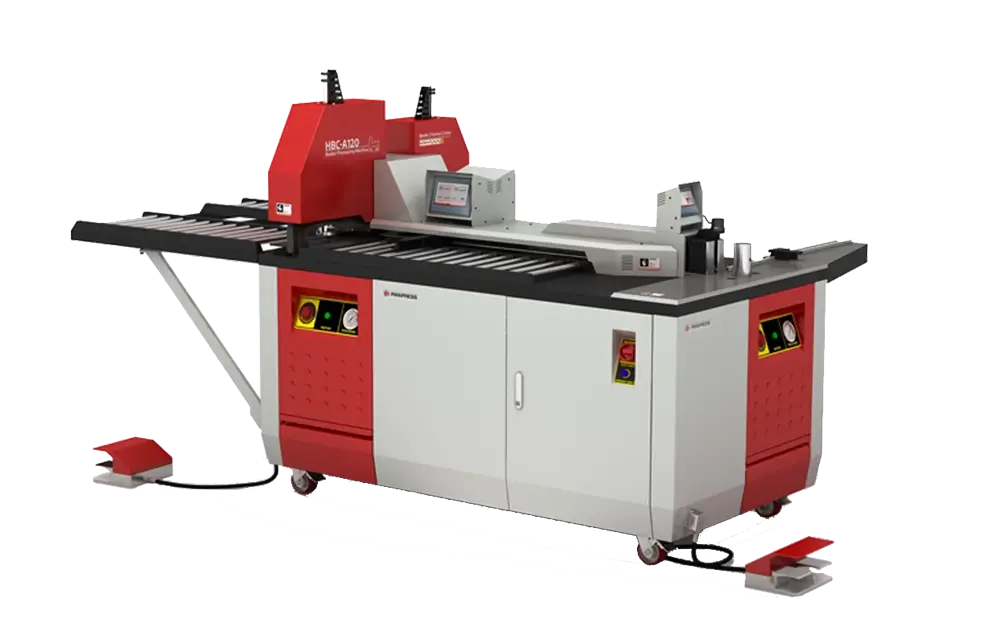
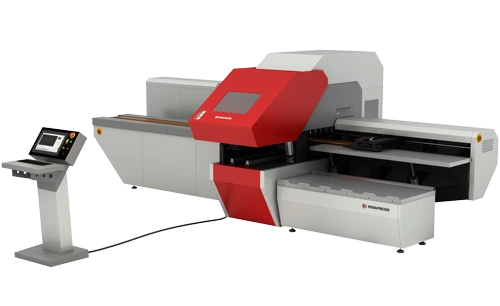
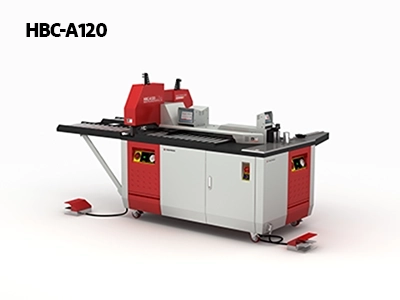
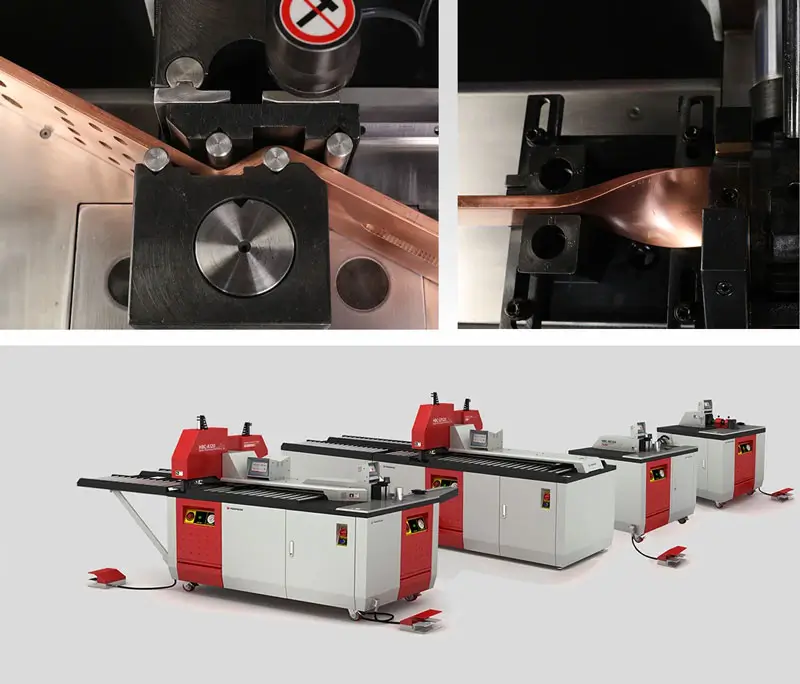
The HBC-EB120 machine performs cutting, punching, and bending operations within a single compact system. Its economical design makes it a practical option for small and medium-sized electrical panel workshops.
Single-Line vs Three-Line vs Schematic Diagrams
The difference between single line diagram and three line diagram drawings is detail. A single-line shows one line per circuit, while a three-line draws every phase conductor, the neutral and the ground, plus the wiring of each current transformer (CT) and potential transformer (PT).
| Diagram type | What it shows | Used for |
|---|---|---|
| Single-line | The whole system, one line per circuit, ratings and protection | Overview, studies, permits |
| Three-line | Every phase, neutral and ground, plus CT and PT wiring | Metering, relay wiring, commissioning |
| Schematic | Control circuits: coils, contacts, pushbuttons | Control logic and troubleshooting |
The difference between single line diagram and schematic diagram types is purpose. A schematic shows control circuits rather than the power path. In practice, you use the SLD to see the system, the three-line to wire meters and relays, and the schematic to fix controls.
Every drawing in this guide depends on the rules that govern the equipment it describes. To see how those rules apply to boards and bus systems, review the main switchgear standards.
Single Line Diagram Symbols
Single line diagram symbols are a visual shorthand: circles for machines and transformers, boxes for equipment, and short marks for switches and breakers. US drawings follow IEEE 315, while IEC drawings follow IEC 60617. The ideas match, but the shapes often differ, so always check the legend sheet first.
Most one line diagram symbols fall into three groups: sources, switching and protection, and distribution equipment. The next three sections cover each group in turn, with the shapes you will see most.
The IEC symbol set now lives in an online database rather than a printed book, which keeps it current. The IEC describes its roughly 1,900 entries in the IEC 60617 database.
Power Sources, Transformers and Generators
The utility service usually appears at the top as a labeled arrow, line or box, often with its voltage and available fault current. A generator is a circle with a G or GEN inside, rated in kW or kVA. Similarly, a motor at the bottom of the page is a circle with an M.
A transformer is two touching or overlapping circles, one for each winding. Its label tells you three things: the kVA (power rating), the voltages (for example, 13.8 kV to 480Y/277 V) and the %Z (percent impedance). The kVA sets how much load it can carry. Meanwhile, the %Z limits how much fault current it lets through, so a lower %Z means a higher fault current downstream.
Most US drawings use the symbol set first issued as ANSI Y32.2 and later as IEEE 315, which IEEE now lists as inactive-reserved. The IEEE catalog describes the graphic symbols and reference letters in its IEEE 315 listing.
Switching and Protection Devices
The circuit breaker symbol single line diagram readers meet most is a square box, often tagged 52 on medium-voltage drawings; low-voltage breakers often show as a small arc. A fused switch adds a fuse rectangle to a switch blade, while a disconnect shows only the blade.
An automatic transfer switch (ATS) is a box with two inputs. A current transformer is a small circle or loop on the line, labeled with its ratio, such as 2000:5. A protective relay is a circle holding its device number, with a dashed line to its CT and breaker.
Finally, check whether each device is normally open vs normally closed. Drawings use N.O. or N.C. tags or open and closed contacts. A main breaker is normally closed; a tie breaker is often open.
Busbars, Panels and Loads
A bus is a heavy horizontal line with its rating written beside it, such as 480Y/277 V, 3 phase, 4 wire, 2,000 A, 65 kA. The amps give the continuous rating, while the kA gives the short-circuit rating. Bus duct, the enclosed busbar that links equipment, appears as a heavy or double line with its own amp rating.
Equipment such as a switchboard, motor control center (MCC) or panelboard appears as a labeled box around its bus. Each feeder leaves the bus through a breaker and runs down to its load, so motors and lighting panels sit at the bottom.
Symbols are only one part of a larger rulebook that differs between regions and industries. Our electrical standards guide sorts the main codes in one place.
ANSI Device Numbers You Will See
ANSI device numbers on single line diagram sheets come from IEEE C37.2. Each number names a function, not a product. Suffixes add detail, such as 51G (ground) or 87T (transformer).
| Number | Function | What it does |
|---|---|---|
| 25 | Synchronizing or sync-check | Checks two sources match before closing |
| 27 | Undervoltage relay | Trips or alarms on low voltage |
| 50 | Instantaneous overcurrent relay | Trips with no delay |
| 51 | AC time overcurrent relay | Trips after a current-based delay |
| 52 | AC circuit breaker | Opens and closes the power circuit |
| 59 | Overvoltage relay | Trips or alarms on high voltage |
| 81 | Frequency relay | Acts on under- or over-frequency |
| 86 | Lockout relay | Holds breakers open until reset |
| 87 | Differential relay | Compares current in and out of a zone |
Numbers often combine, for example 50/51 for a relay that does both overcurrent jobs.
Because the numbers describe functions, one table decodes most protection drawings. ANSI notes that the 2022 edition assigns 95 numbers and 22 acronyms in its IEEE C37.2 summary.
These relays and breakers sit inside panels of many different designs. If you want to match each device to its enclosure, browse the electrical panel types covered in this US guide.
How to Read a Single-Line Diagram, Step by Step
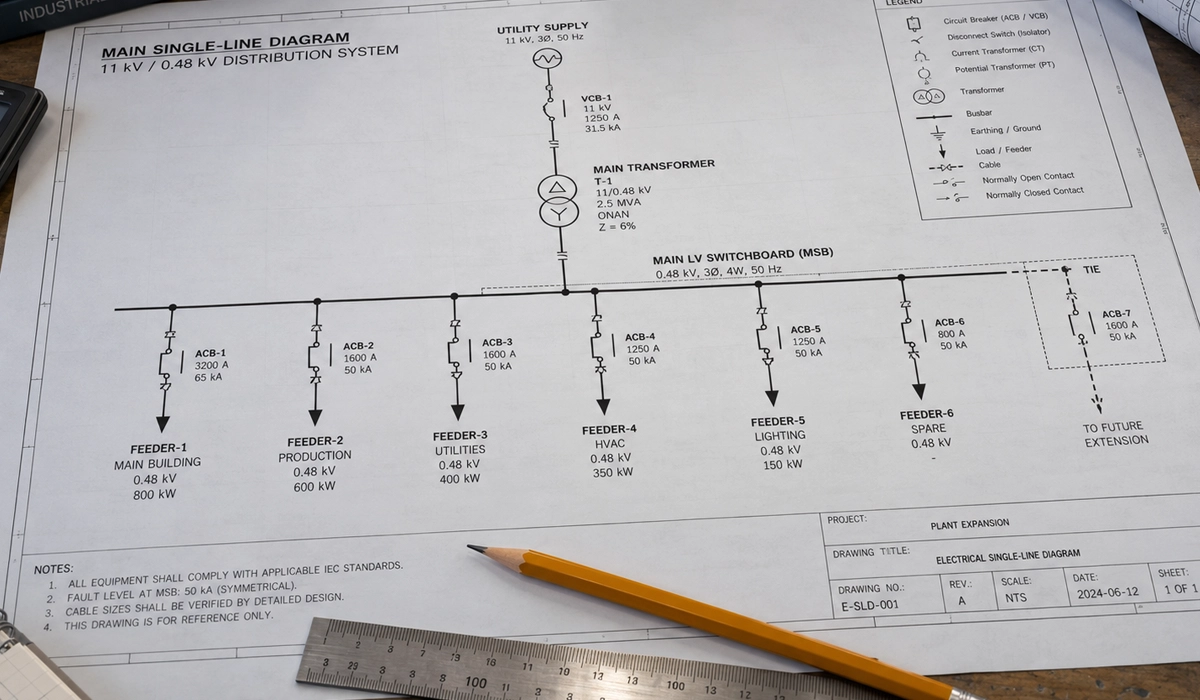
Here is how to read a one line diagram in five steps. Print the sheet, or open it at full size, and read from top to bottom with a highlighter. Mark each source, each voltage level and each protective device as you go, and by the end the colors show the whole system.
First, confirm the drawing is current, because an old sheet can hide a new feeder. An EFCOG best-practice guide quotes the rule that a provided single-line diagram must stay legible and current in its NFPA 70E crosswalk.
Step 1: Start at the Source
Start at the top and find every source before you trace anything. The main source is usually the utility service, but many plants also have a standby generator, a UPS (uninterruptible power supply) or a solar PV array. Circle each one clearly in red. Next, note where each source enters the system, because you cannot make a bus with two feeds safe by opening one breaker. As a result, a missed source is an easy reading error and also a dangerous one.
Step 2: Follow the Voltage Levels
Every transformer changes the voltage, so mark each level with its own color. A typical plant steps down from 13.8 kV utility power to 480 V for motors, then to 208/120 V for lighting and receptacles. Check each transformer label for its kVA and voltage pair, and write the voltage on every bus below it. A substation one line diagram follows the same logic at higher voltages, such as 69 kV or 138 kV, with more breakers and relays on each bus.
Step 3: Identify Protection and Switching
Next, find the main breaker on each bus and every feeder breaker below it. For each one, note which bus it isolates and which loads go dark when it opens. Then look for each protective relay nearby and read its device numbers, such as 50/51 on a feeder or 87 on a large transformer. Finally, follow the dashed lines from each relay to its CT and to the breaker it trips. This shows what protects each zone and which device should clear a fault first, before any upstream breaker trips.
Step 4: Read Ratings (A, kA, kVA, %Z)
Ratings sit beside every device, and each unit tells a different story:
- A (amps): the continuous current rating of a bus, breaker or cable.
- kA: the short-circuit rating, or the available fault current at that point.
- kVA: the power rating of a transformer or generator.
- %Z: the transformer impedance, which limits fault current.
Compare the available fault current at each bus with the kA rating of the equipment on it. NEC 110.9 requires interrupting ratings high enough for the fault current available, and the same kA values feed arc-flash studies. In short, a busbar or bus duct rated 65 kA must never sit where 80 kA is available.
Step 5: Trace Alternate Sources and Interlocks
Finally, trace what happens when the normal source fails. An automatic transfer switch moves critical loads to the generator, while a tie breaker can link two buses in a double-ended switchboard. Look for key interlocks, often shown as a small K or a note, that stop two sources from closing onto the same bus. Then ask one question for each case: which breakers close, and which loads stay on? For example, during a utility outage, only the loads behind the ATS should stay on.
Every feeder line on a drawing stands for a real conductor with its own construction and rating. To choose the right conductor for each feeder, compare the wire and cable types used in industrial work.
Worked Example: Reading a Simple Plant SLD
This simple single line diagram example shows a small plant; every rating below is an example value. Read each callout, then find the same block on your own drawing.
- Utility service: 13.8 kV, three phase, with available fault current noted.
- Transformer T1: 1,500 kVA, 13.8 kV to 480Y/277 V, 5.75 %Z. Full-load current is about 1,804 A.
- Main switchboard: 2,000 A bus rated 65 kA, fed through a 2,000 A main breaker (52-M) with 50/51 protection.
- Feeder 1: an 800 A breaker to the motor MCC.
- Feeder 2: a 125 A breaker to a 75 kVA transformer, 480 V to 208Y/120 V, then a 225 A panelboard.
- Feeder 3: a 400 A breaker to a 400 A ATS, with a 250 kW generator on its emergency side.
- Feeder 4: a 400 A spare, normally open.
Now check the numbers. With 5.75 %Z, T1 alone can deliver about 1,804 ÷ 0.0575, or roughly 31 kA (computed, infinite-source estimate), before motor contribution. Therefore, the 65 kA bus rating leaves a clear margin.
These bus fault values are also the inputs an arc-flash study needs at each point. IEEE explains the models for arc-flash boundary and incident energy in its IEEE 1584 guide.
Once the fault values are known, the results must be shown on the equipment itself. Our quick reference explains the arc flash labels that NFPA 70E and IEEE 1584 require.
From Single-Line Diagram to Busbar Cut List
Moving from single line diagram to busbar sizing is where the drawing meets the shop floor. Each bus rating sets the bar cross-section, the bars per phase and the hole patterns.
Take the example’s 2,000 A main bus. A shop might use two 1/4 in × 4 in copper bars per phase, or 2 in² per phase (example values). The 65 kA rating sets support spacing.
Next, every breaker, lug and bus duct joint on the drawing becomes a hole pattern, such as NEMA two-hole lugs at 1-3/4 in centers. The panel shop then turns them into a cut, punch and bend list.
Bar size, joints and short-circuit forces all follow the drawing’s current figures. The Copper Development Association covers current rating, fault stresses and jointing in its busbar design guide.
Turning a drawing into finished bar also brings quality and safety duties for the shop. Learn how makers meet those duties in this guide to busbar compliance.
How to Draw a Single-Line Diagram
A good SLD follows the rules you read: source at the top, loads at the bottom, one symbol set and a rating beside every device. Tag each device uniquely and add a legend.
Single line diagram software falls into three broad groups. General CAD tools suit simple sheets, electrical CAD adds symbol libraries and reports, and power-system analysis tools link the drawing to fault and arc-flash studies.
If you need to know how to draw a single line diagram for inspection, check with the utility or permit office first. Most want ratings, conductor sizes and every disconnect location.
Permit offices often publish exact checklists for these submittals. Larimer County, Colorado, lists the conductor, grounding and disconnect details it expects on a one-line drawing in its permit submittal guidelines.
A drawing is only as good as the assembly it describes. For European projects, see how design verification proves that a low-voltage assembly meets the standard.
Conclusion: How to Read a Single-Line Diagram
Reading any single line diagram electrical crews rely on takes five steps. First, find every source. Second, follow the voltage levels. Third, identify protection and switching. Fourth, read the ratings and compare the kA at each bus. Fifth, trace alternate sources and interlocks. Practice on the plant example, then apply the same steps to your own drawings. To keep the symbols at hand, download our free symbol legend PDF and pin it beside your next set of drawings.
Once you can read the power path, the next step is understanding how faults return to the source. Our guide to the grounding system is a good next read.

Rate this article
Choose a rating from 1 to 5 stars.
No ratings yet
0 Comments
No comments yet. Be the first to comment.