






If you’d rather listen than read, feel free to play the audio file below for the rest of this article.
What Lowers Copper Conductivity
Both chemistry and processing matter because they change how electrons move through the metal.
Impurities and alloying elements alter composition. In contrast, cold work changes the metal’s structure without requiring a different chemical grade.
Therefore, compare annealed copper with annealed copper when assessing purity. Then check the supplied temper separately before using a conductivity figure in a loss calculation. A higher strength requirement therefore does not establish a lower electrical resistance.
| UNS | CDA | EN number | EN/ISO name |
|---|---|---|---|
| C11000 | 110 | CW004A | Cu-ETP |
| C10200 | 102 | CW008A | Cu-OF |
| C10100 | 101 | CW009A | Cu-OFE |
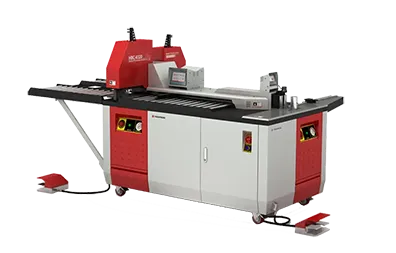
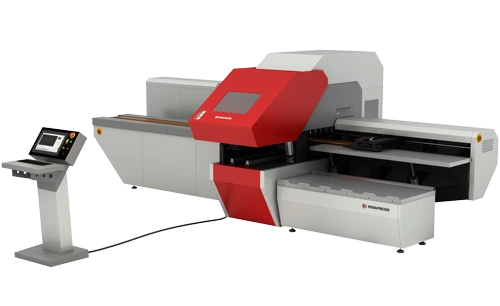
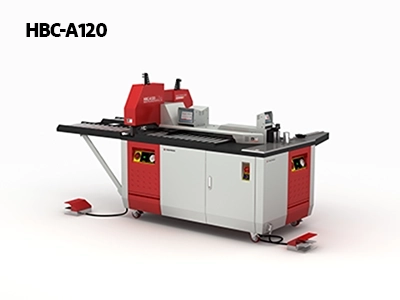
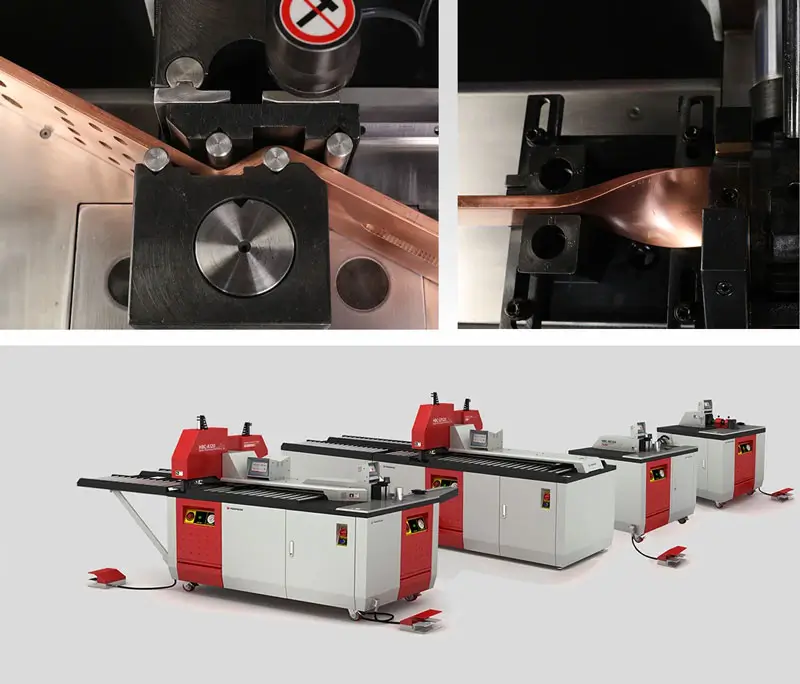
The HBC-A120 machine performs cutting, punching, and bending operations on copper and aluminum busbars up to 120 × 12 mm. Its three independent hydraulic stations allow simultaneous operations, improving productivity in electrical panel and switchgear manufacturing.
Impurities and Alloying
Residual phosphorus can reduce conductivity substantially, so phosphorus-deoxidized copper is not automatically interchangeable with electrical-grade ETP. The amount matters: very low residual levels have a smaller effect. In contrast, small silver additions can improve resistance to softening while preserving high conductivity. Alloy names alone therefore provide an incomplete basis for comparing losses.
Oxygen-free copper also retains high conductivity and avoids the oxygen-related hydrogen embrittlement risk associated with heating ETP in reducing atmospheres. That distinction matters during welding or brazing, rather than ordinary bolted service. Compare the chemistry, processing conditions, and electrical requirements together before approving a substitute grade.
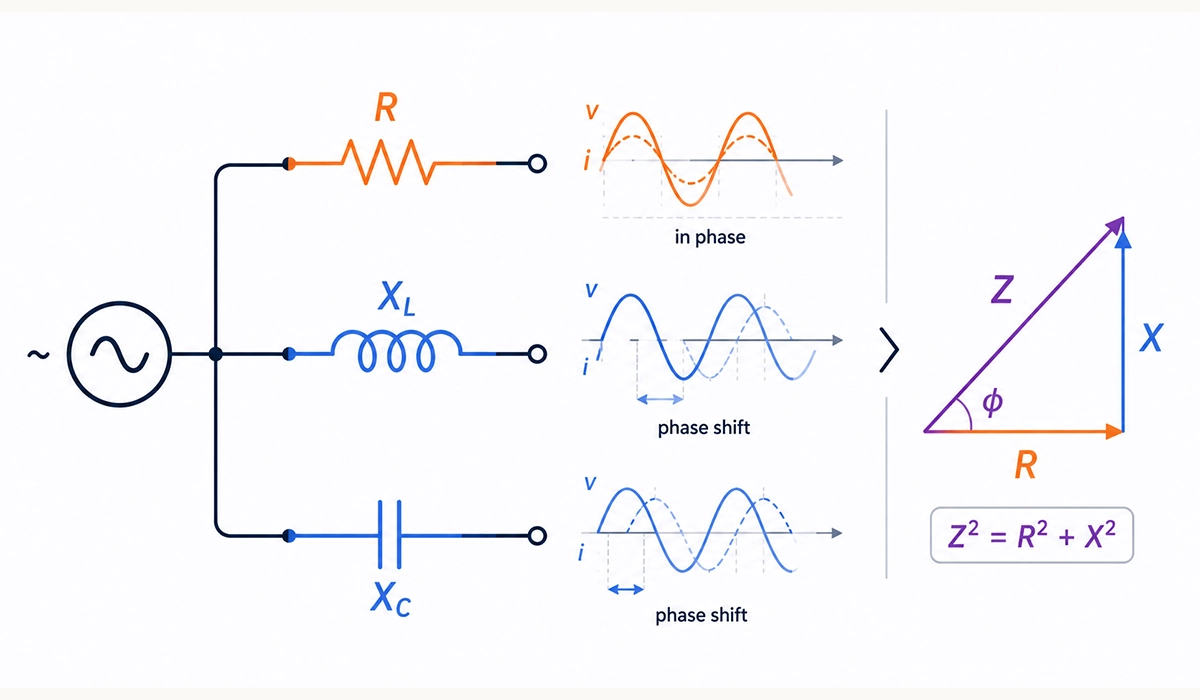
Material grade and temper are only one layer of the picture. Revisiting the electrical fundamentals behind resistivity makes it easier to judge why composition and processing change losses.
Cold Work and Temper
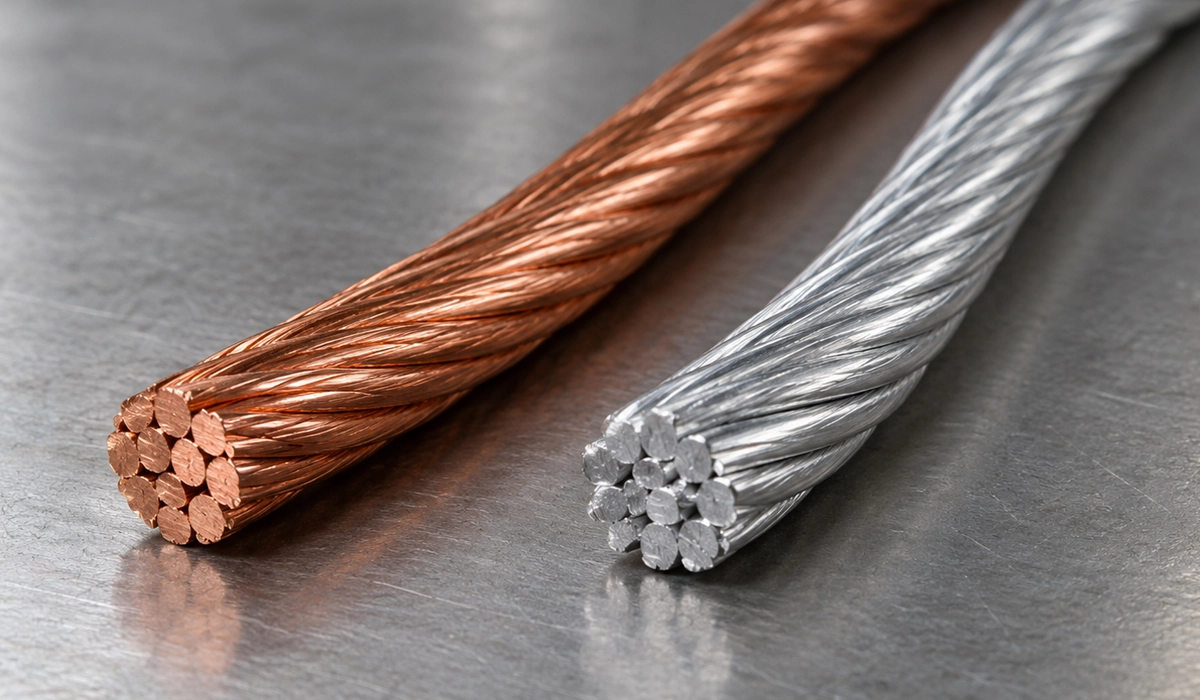
Cold work increases hardness and strength but usually reduces conductivity modestly. NBS wire data indicates approximately 2.5% lower conductivity for hard-drawn wire relative to the standard annealed reference. However, this is a general comparison, not an automatic correction for every bar or bending operation.
Temper often matters more to bending and forming than this small electrical difference suggests. Harder stock offers less ductility, so confirm the forming requirements as well as conductivity. For purchasing, request both the grade and temper; “high-conductivity copper” alone leaves the mechanical condition unclear. Therefore, validate bending settings with the actual stock before releasing production instructions.
Comparing metals ultimately comes down to how strongly a conductor opposes the flow of charge. If those terms feel unclear, review current and resistance before comparing conductor sections.
Copper vs Silver vs Aluminum Conductivity
Compare representative values near 20 °C. Percentages and resistivities are approximate because purity and processing vary.
| Metal | %IACS | Resistivity, µΩ·cm | Density, g/cm³ | Typical use |
|---|---|---|---|---|
| Silver | ≈108 | ≈1.59 | 10.49 | Contacts, plating |
| Electrical copper | ≈100–101 | ≈1.71–1.72 | ≈8.9 | Busbars, wire |
| EC aluminum | ≈61 | ≈2.83 | ≈2.70 | Overhead conductors, busbars |
Silver vs copper conductivity comparisons favor silver electrically, but its cost limits bulk use.
Small alloy additions can improve strength while reducing electrical performance. The size of that trade-off depends on composition, as explained in copper alloy guidance.
For aluminum vs copper conductivity, copper offers lower resistance at equal dimensions. Aluminum needs about 1.64 times the area for equal DC resistance, yet weighs less. Copper favors compact sections and simpler joints; aluminum favors weight and material cost. For this resistance comparison, also hold length and temperature constant. Equal resistance does not establish equal ampacity because cooling depends on the conductor and installation.
Density and resistivity must be considered together. A university-hosted engineering handbook provides the underlying conductor property comparison.
Thermal Conductivity of Copper
The thermal conductivity of copper is around 400 W/(m·K) near room temperature, depending on grade and condition. For example, the busbar design guide reports 397 W/(m·K) at 20 °C. Treat this as a material property, not a guaranteed operating temperature.
Copper thermal conductivity describes heat transport; electrical conductivity describes charge transport. However, the properties are related because mobile electrons carry both energy and charge. The Wiedemann–Franz relationship expresses this connection approximately for metals, with temperature and scattering conditions affecting its accuracy.
In a busbar, conduction spreads heat away from a warmer bolted joint. Nevertheless, that heat must leave through the surroundings. Airflow, surface area, enclosure conditions, and contact resistance still influence temperature rise; high thermal conductivity cannot compensate for a defective connection. Therefore, verify heat removal as well as spreading.
Thermal and electrical values therefore need consistent conditions. A university-hosted physics experiment explores the underlying connection through the Wiedemann–Franz law.
The heat a conductor must dissipate starts with the current it carries. That current depends on the supply system, so see how it changes in single-phase vs three-phase power.
From Resistivity to Busbar Resistance and Heat
To calculate the resistance of copper busbar per meter, use R = ρL/A. Here, L is length and A is cross-sectional area. Electrical loss follows P = I²R, using resistance in ohms.
Computed example: uniform 100 × 10 mm bar, 1 m long, 100% IACS material, carrying 1,000 A DC.
- Area: 1,000 mm² = 0.001 m².
- R20 = (1.7241 × 10⁻⁸ × 1)/0.001 = 17.241 µΩ.
- P20 = 1,000² × 17.241 × 10⁻⁶ = 17.241 W/m.
- At 90 °C: resistance ≈ 21.984 µΩ; loss ≈ 22.0 W/m.
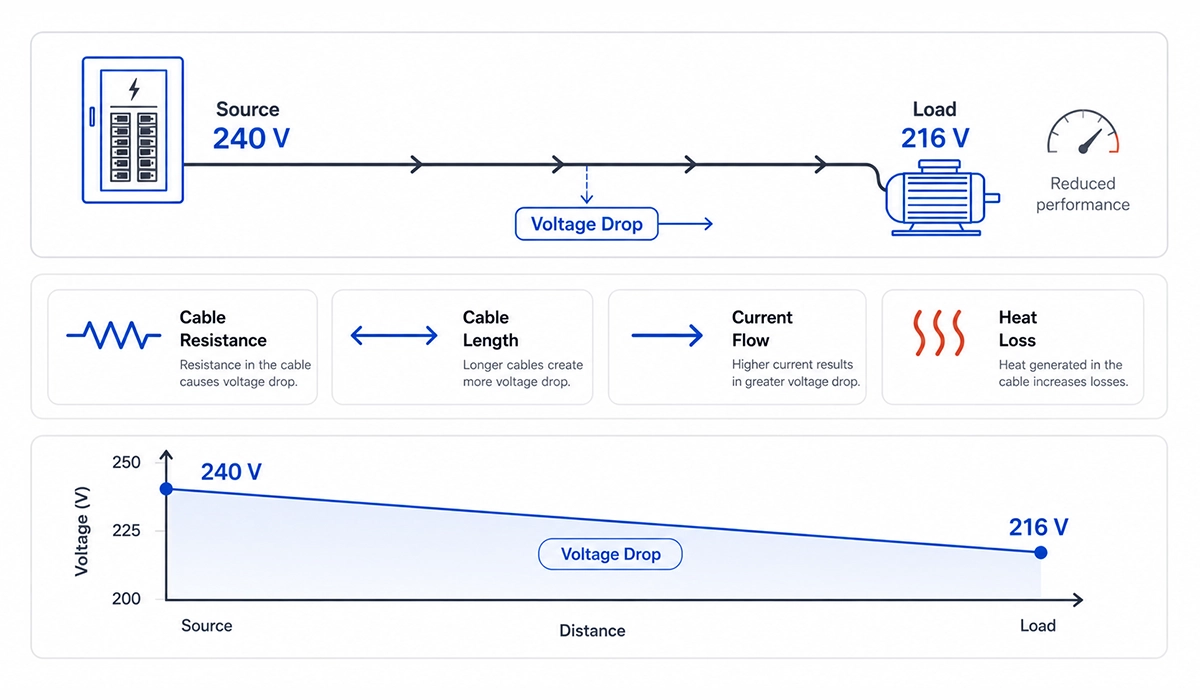
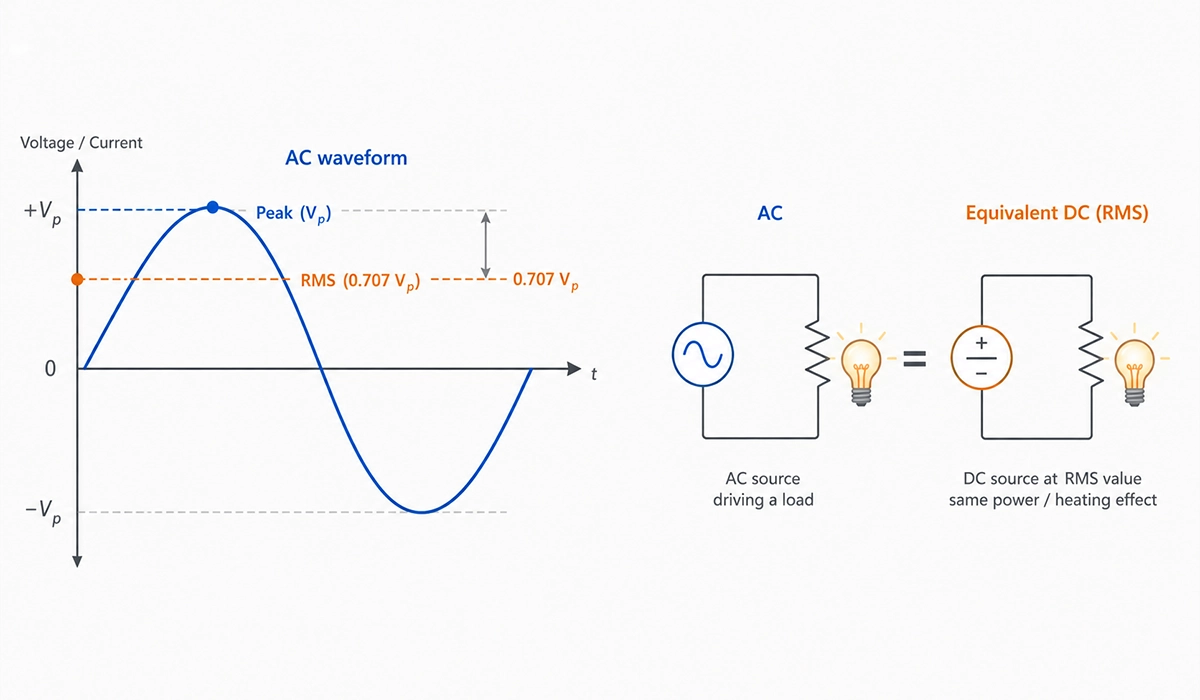
These calculations exclude joint losses and assume uniform temperature. Because loss scales with current squared, doubling current quadruples loss at fixed temperature. Additional heating, however, also changes resistance. The 90 °C condition is an assumed calculation point, not an approved operating limit. AC skin effect and proximity effect can increase resistance, especially with larger sections.
Actual current capacity requires a heat balance as well as resistance. The Copper Development Association explains these additional checks in its busbar design guide.
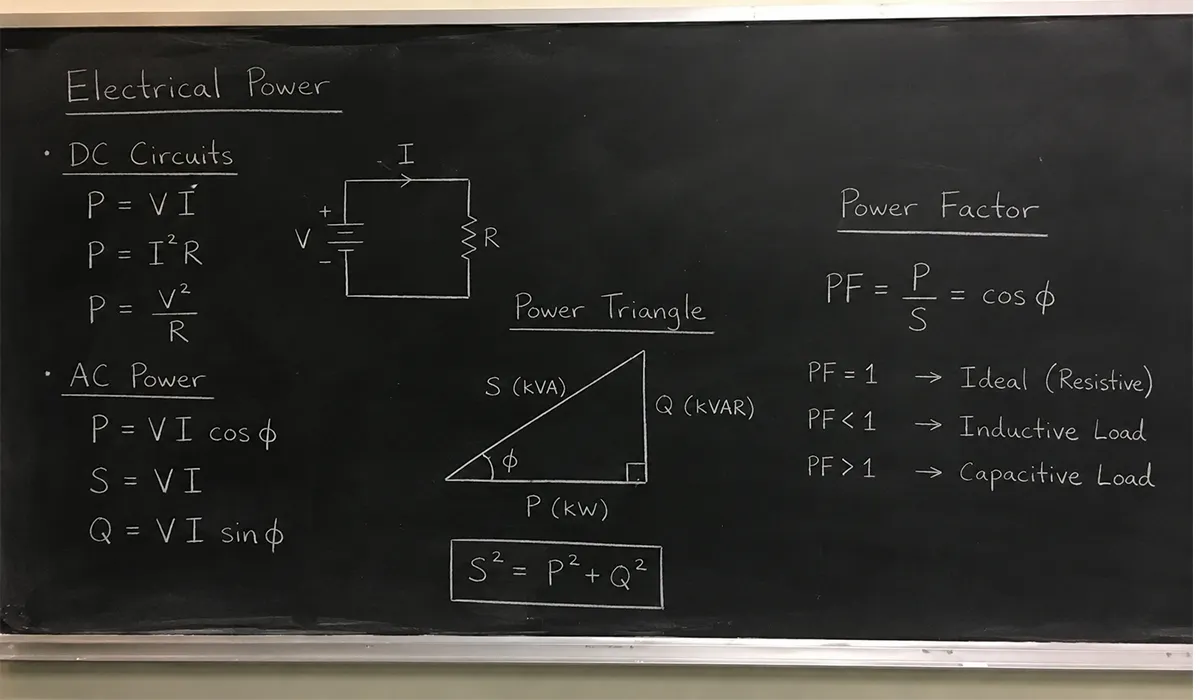
Busbar loss follows directly from the power relationship P = I²R. For other ways of calculating power in a circuit, see the electrical power formula.
How Copper Conductivity Is Measured
Choosing how to measure conductivity of copper depends on sample geometry. A four-wire Kelvin measurement separates current leads from voltage-sensing leads, reducing lead-resistance error. For known geometry, calculate ρ = RA/L, then σ = 1/ρ.
Alternatively, an eddy-current conductivity meter reads %IACS or S/m on suitable flat or slightly curved surfaces. Calibrate against appropriate reference standards and account for temperature.
Request conductivity results on the mill certificate, together with grade, temper, and test conditions. This supports comparison with the calculation assumptions. Also, measure sample dimensions carefully because an area error changes the resistivity calculated from the resistance measurement.
Very small resistances require control of lead and thermal-voltage errors. Keithley explains these effects and their mitigation in its measurement error guide.
Every resistance reading in these methods relies on the basic relationship between voltage, current and resistance. If you need a refresher on how that relationship works, read about Ohm’s law.
Conclusion: Copper Conductivity and Resistivity
The reference resistivity of copper is 1.7241 × 10⁻⁸ Ω·m at 20 °C.
Resistance rises approximately 0.393% per degree relative to that baseline.
Therefore, match the conductivity of copper to grade, temper, and temperature before applying the copper busbar guide.
US material specifications distinguish composition, electrical properties, and mechanical condition for the conductor stock that will ultimately enter the finished assembly. Specify the applicable requirements using ASTM B187/B187M.
Rate this article
Choose a rating from 1 to 5 stars.
No ratings yet
0 Comments
No comments yet. Be the first to comment.